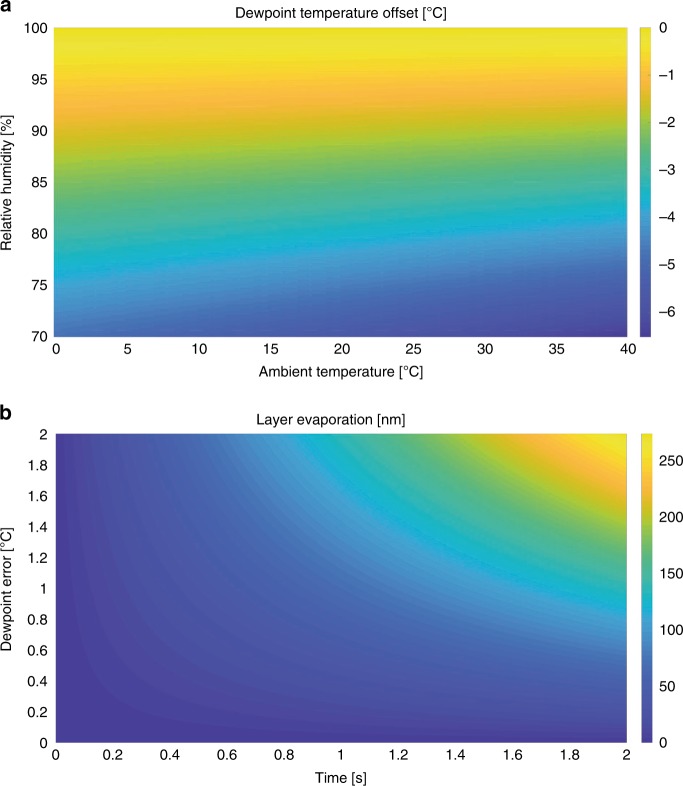
Fig. 1. Dew-point temperature calculations and predictions.
a Dew-point temperature offset (color scale, in degrees) as a function of the relative humidity and ambient temperature. E.g., when working at 20 °C and 94% relative humidity, the dew-point temperature would be 1 °C (orange) below the ambient temperature. b Predicted decrease in thickness of a thin sample layer due to evaporation (color scale, in nm/s) with respect to the time and the dew-point error, which is the difference between sample temperature and its dew point. E.g., for a temperature of 1 °C above dew point, 70 nm of the layer is estimated to evaporate within 1 s.

