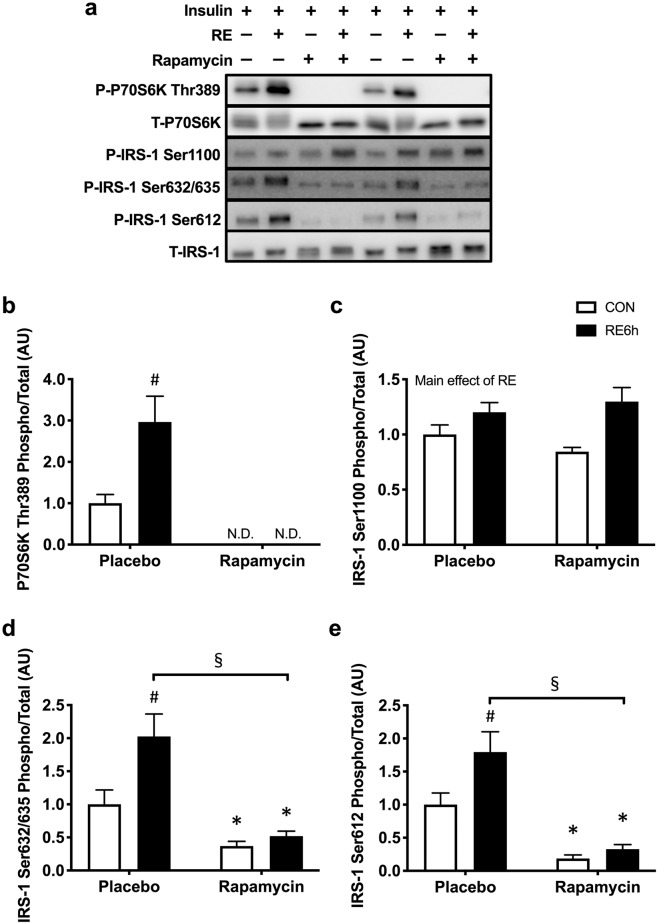
Figure 6.
Effect of rapamycin on mTORC1/IRS-1 pathway activation by RE. (a) Representative Western blot images. The grouping of blots cropped from different parts of the same gel, or from different gels, fields, or exposures were divided by black lines. (b) P70S6K Thr389, (c) IRS-1 Ser1100, (d) IRS-1 Ser632/635 and (e) IRS-1 Ser612 phosphorylation in response to single bout of RE under treatment of either placebo or rapamycin. n = 4 in each group. Values are means ± standard error. *P < 0.05 versus placebo injection within CON or RE legs, ♯P < 0.05 versus CON leg for each group, §P < 0.05 versus response to RE (interaction of RE × rapamycin). RE, resistance exercise; CON, unstimulated control.

