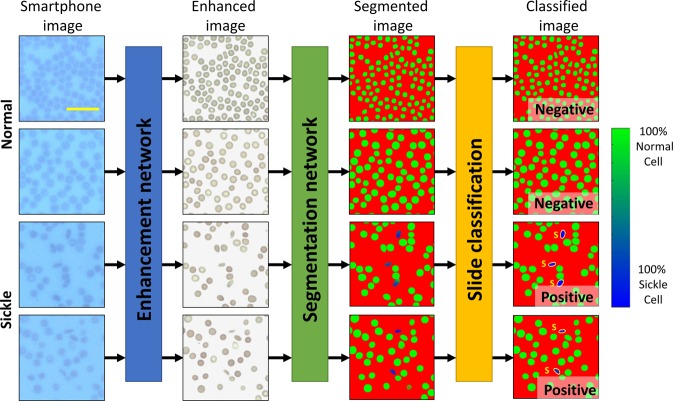
Fig. 2. Example image patches.
Demonstration of various test image patches that passed through the various steps of the automated sickle cell analysis framework. The smartphone microscopy images are first passed through an image enhancement and standardization network. Following this step, the images are segmented using a second, separate neural network. This segmentation network is in turn used to determine the number of normal and sickle cells within each image; five fields-of-view together covering ~1.25 mm2 is automatically screened, having on average 9630 red blood cells to make a diagnosis for each patient blood smear. Scale bar indicates 20 μm.

