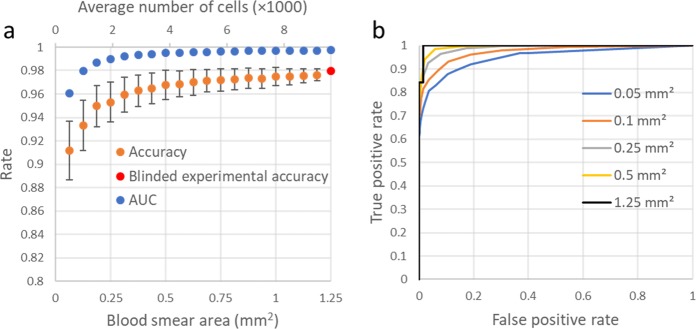
Fig. 4. Accuracy as a function of the number of cells counted.
a Plot of how the accuracy and AUC change as a function the number of cells (and the blood smear area) inspected by our method. b ROC curves for various simulated blood smear areas. These plots (except the 1.25 mm2 one, which is our experimental result) are based on the average of 1000 Monte Carlo simulations performed by removing the red blood cells from the imaging fields-of-view at random to change the number of cells inspected by our method. As the cells are relatively monodisperse, this random removal of the cells simulates a reduction in the inspected blood smear area per patient. Error bars represent the standard deviation (s.d.) across the 1000 Monte Carlo simulations.

