Figure 1.
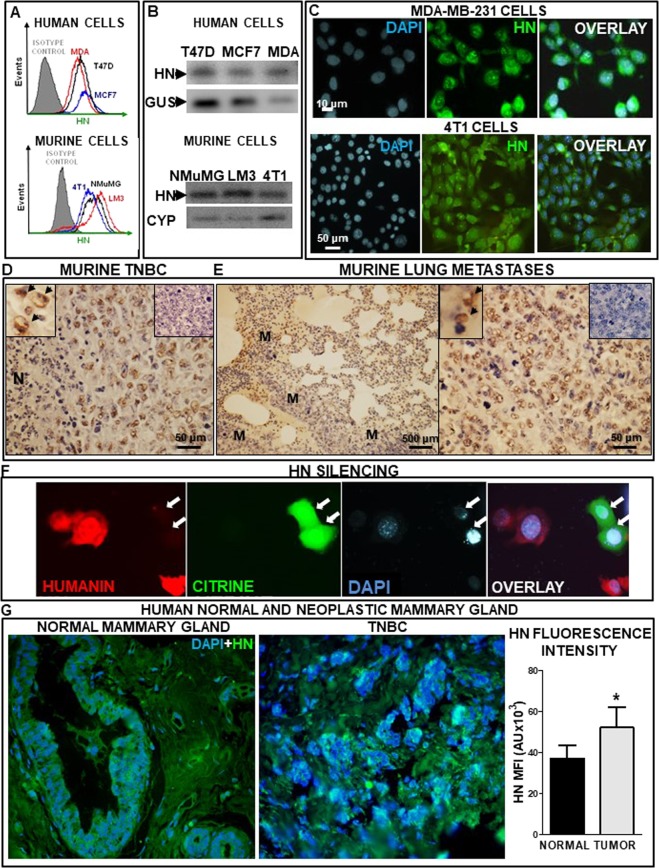
HN expression in human and murine breast tumor cells and tissues. HN expression was evaluated in human breast tumor cells MCF7, T47D and MDA-MB-231 (MDA) and in murine NMuMG, LM3 and 4T1 cells. (A) Representative histograms show the mean fluorescence intensity (MFI) of tumor cells, as assessed by flow cytometry. (B) Representative gel shows the expression of HN mRNA and internal control β-glucuronidase (GUS) or cyclophilin (CYP), as assessed by RT-PCR. (C) Images show the expression of HN in human (MDA-MB-231) and murine (4T1) TNBC cells, as evaluated by immunofluorescence. Images show HN (green), nuclei stained with DAPI (blue) and their overlay. (D) Representative microphotographs show HN expression as assessed by immunohistochemistry in paraffin sections of primary 4T1 TNBC tumors. Insets show cells expressing HN (left, arrows) and a control without primary antibody (right). N: necrotic area. (E) Low (left) and high (right) magnification images showing HN expression in metastatic nodules (M) in lungs from 4T1 TNBC-bearing mice. Insets show cells expressing HN (left, arrows) and a control without primary antibody (right). (F) Images show the expression of HN in murine (4T1) TNBC cells transfected with p.shHN, as evaluated by immunofluorescence. Images show HN-positive cells (red), citrine-positive (transfected cells, green), nuclei stained with DAPI (blue) and their overlay. Arrows indicate transfected cells that do not express HN. (G) Representative microphotographs show HN expression (green) as assessed by immunofluorescence in paraffin sections from mammary gland samples from healthy donors that underwent cosmetic breast surgery (left panel) and tumor biopsies from TNBC patients (right panel). Nuclei stained with DAPI (blue). The graph depicts the median fluorescence intensity (MFI) of HN immunofluorescence in samples of normal mammary gland (n = 5) or biopsies from breast tumor patients (n = 5), as analyzed with ImageJ software. To obtain the fluorescence intensity/field for each sample a mean value was calculated by assessing 20 fields.

