Figure 2.
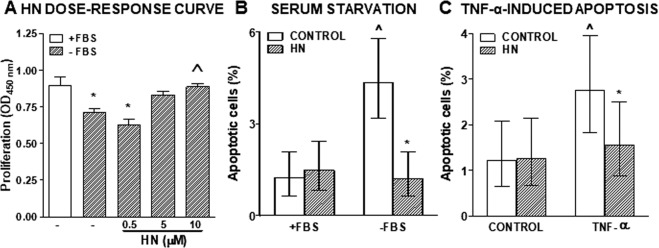
Effect of HN on proliferation and apoptosis of murine TNBC cells. (A) 4T1 cells were incubated with or without FBS in the presence of different concentrations of HN for 18 h (n = 4 replicates/condition) and proliferation was assessed by BrdU incorporation (ELISA). *p < 0.05 vs. +FBS, ^p < 0.05 vs.-FBS (ANOVA followed by Tukey´s test). (B) 4T1 cells were incubated with or without FBS in the presence of HN (10 μM) for 24 h and apoptosis was assessed by the TUNEL method. Bars indicate the percentage of apoptotic cells ± 95% confidence limits (CL) of the total number of cells counted in each specific condition (n ≥ 1000 cells/group). Confidence intervals for proportions were analyzed by the χ2 test: ^p < 0.05 vs. respective control +FBS, *p < 0.05 vs. respective control without HN (χ2 test). (C) 4T1 cells were incubated in medium with FBS in the presence of HN (10 μM) for 2 h before addition of the proapoptotic cytokine TNF-α (10 ng/ml) for further 24 h. Apoptosis was assessed by the TUNEL method. Bars indicate the percentage of apoptotic cells ± 95% confidence limits (CL) of the total number of cells counted in each specific condition (n ≥ 1000 cells/group). Confidence intervals for proportions were analyzed by the χ2 test: ^p < 0.05 vs respective control without TNF-α, *p < 0.05 vs respective control without HN (χ2 test).

