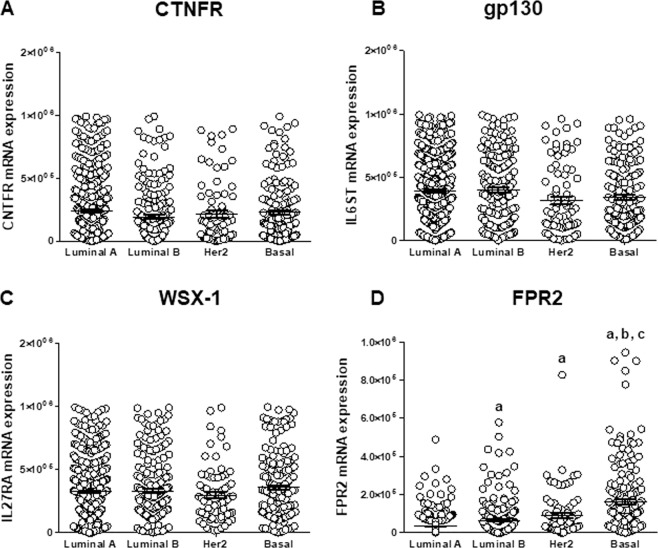
Figure 5.
Bioinformatic analysis of expression of the trimeric receptor subunits and FPR2 in breast cancer specimens. Expression levels of HN trimeric receptor subunits (A) CNTFR (CNTFR mRNA), (B) gp130 (IL6ST mRNA), (C) WXS-1 (IL27RA mRNA) and (D) FPR2 (FPR2 mRNA) were obtained from breast cancer data deposited at the cBioportal for cancer genomics (TCGA PanCancer Atlas). Luminal A n = 461, Luminal B n = 339. HER2 n = 78, Basal n = 169. a: p < 0.05 vs. Luminal A; b: p < 0.05 vs Luminal B, c: p < 0.05 vs. Her2. Oneway ANOVA followed by Tukey’s test.

