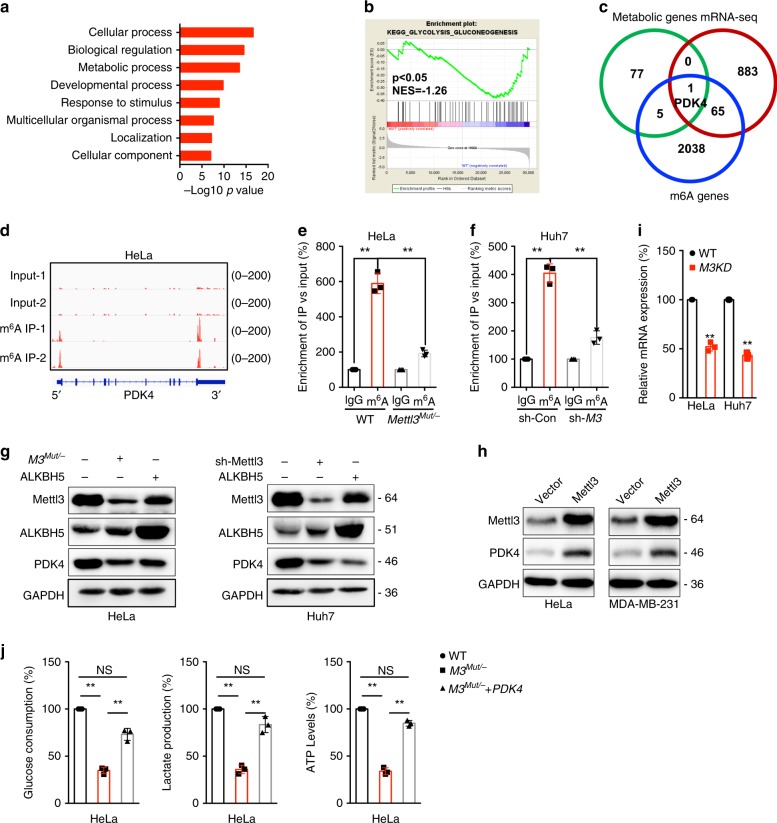
Fig. 2. PDK4 mediates m6A regulated glycolysis and ATP generation of cancer cells.
a Gene ontology analysis was performed on a subset of downregulated genes in Mettl3Mut/- HeLa cells. Log2 fold change, (KD: WT) < −0.5, was applied as the threshold cutoff. Several biological processes involved in metabolic processes were enriched and highlighted in bold; Significance shown as –Log10 Bonferroni p-value after multiple hypothesis correction. b GSEA reveals negative enrichment of genes in glycolysis gluconeogenesis sets of Mettl3Mut/- HeLa cells. c Venn diagram shows substantial and significant overlap among metabolic genes, variated genes in Mettl3Mut/- HeLa cells (>2 folds), and m6A enriched genes in wild type HeLa cells (>3 folds than input). d m6A peaks were enriched in 5′UTR and 3′UTRs of PDK4 genes from m6A RIP-seq data; e m6A RIP-qPCR analysis of PDK4 mRNA in wild type and Mettl3Mut/- HeLa cells. f m6A RIP-qPCR analysis of PDK4 mRNA in sh-Con and sh-Mettl3 Huh7 cells. g The expression of PDK4 in Mettl3Mut/- HeLa, sh-Mettl3 Huh7, or over expression of ALKBH5 and their corresponding control cells were measured by western blot analysis. h Cells were transfected with vector control or Mettl3 construct for 24 h, the expression of PDK4 was measured. i The mRNA of PDK4 in Mettl3Mut/- HeLa, sh-Mettl3 Huh7 and their corresponding control cells were measured by qRT-PCR. j The glucose consumption, lactate production, and ATP levels in wild type or Mettl3Mut/- HeLa cells transfected with PDK4 constructs for 24 h. Data are presented as the mean ± SD from three independent experiments. A representative from a total of two to three independent experiments is shown for (g) and (h). **p < 0.01, NS, no significant, by random permutation test for (b), by two-way ANOVA for (e) (p = 0.0001 and p = 0.0004, respectively) and (f) (p < 0.0001 and p = 0.0007, respectively), two-tailed unpaired Student’s t test for (i) (p < 0.0001), and one-way ANOVA for (j) (p < 0.0001 and p = 0.0008 for glucose consumption, p < 0.0001 and p = 0.0011 for lactate production, and p < 0.0001 for ATP levels, respectively).

