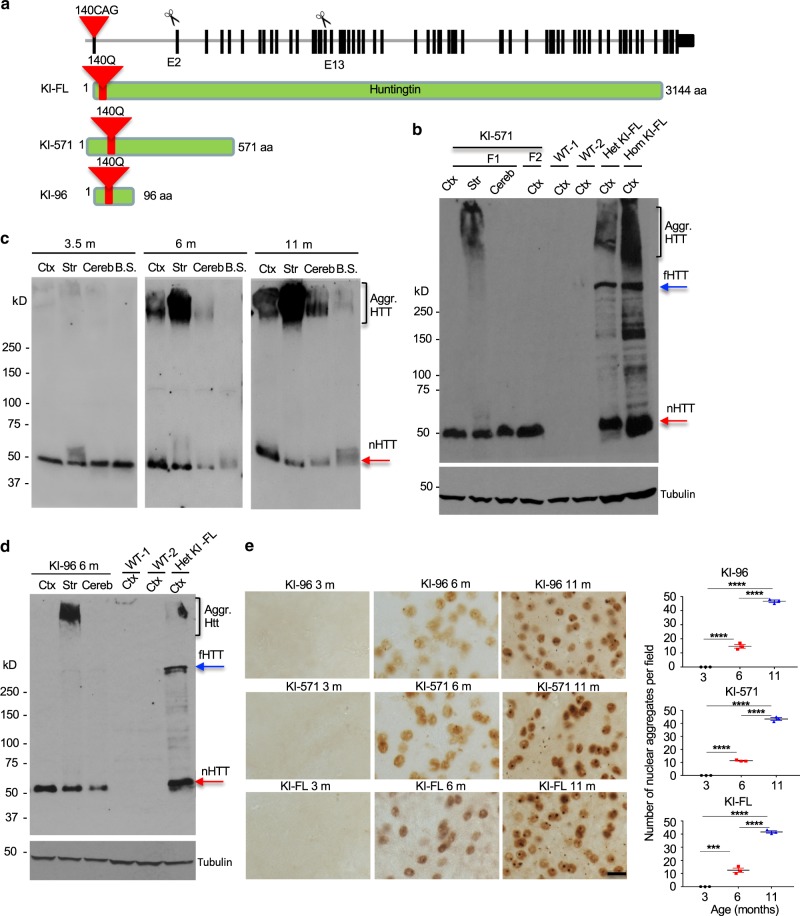
Fig. 2. Generation of HD KI mice expressing different N-terminal HTT fragments.
a Generation of new HD KI mouse models by truncating exon 2 and exon 13 of the mouse HTT gene in HD140Q KI (KI-FL) mice via CRISPR/Cas9, resulting in the expression of truncated mutant HTT containing the first 96 and 571 amino acids in KI-96 and KI-571 mice, respectively, with an additional 140Q repeat. b mEM48 western blotting showing the specific expression of mutant HTT in KI-571 mouse brains. This N-terminal mutant HTT (nHTT) is at the same size as the smallest mutant HTT in KI-FL mouse brain and forms aggregated HTT in the striatum. c mEM48 western blotting revealing an age-dependent aggregation of mutant HTT in KI-571 mouse brain. d mEM48 western blotting showing the specific expression of mutant HTT in KI-96 mice, which also has the same size as the smallest mutant HTT in KI-FL mouse brain and preferentially forms aggregated HTT in the striatum. More than three times of experiments were performed independently for b–d. In a–d, Ctx cortex, Str striatum, Cereb cerebellum. F1 F1 generation, F2 F2 generation. Aggr. HTT aggregated HTT, nHTT n-terminal HTT, fHTT full-length HTT. e mEM48 immunostaining showing an age-dependent accumulation of mutant HTT in the striatum in KI-96, KI-571, and KI-FL mice. Scale bar: 10 μm. Quantification of immunostaining results in Fig. 2e were obtained by counting six images per brain region per mouse (n = 3 mice per genotype, ***p < 0.001, ****p < 0.0001, one-way ANOVA followed by Tukey’s multiple comparison tests, KI-FL, F = 408.1, p < 0.0001; KI-571, F = 1195, p < 0.0001; KI-96, F = 720.8, p < 0.0001). Data are presented as mean values ± SEM. Source data are provided as a Source Data file.

