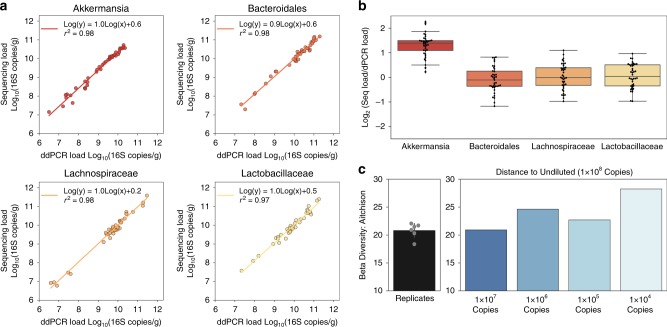
Fig. 3. Digital PCR (dPCR) anchoring of 16S rRNA gene amplicon sequencing provides microbial absolute-abundance measurements.
Taxon-specific dPCR demonstrates low biases in abundance measurements calculated by 16S rRNA gene sequencing with dPCR anchoring. a Correlation between the Log10 abundance of four bacterial taxa as determined by taxon-specific dPCR and 16S rRNA gene sequencing with dPCR anchoring (relative abundance of a specific taxon measured by sequencing × total 16S rRNA gene copies measured by dPCR). b The Log2 ratio of the absolute abundance of four bacterial taxa as determined either by taxon-specific dPCR or by 16S rRNA gene sequencing with dPCR anchoring (N = 32 samples). Data points are overlaid on the box and whisker plot. The body of the box plot goes from the first to third quartiles of the distribution and the center line is at the median. The whiskers extend from the quartiles to the minimum and maximum data points within the 1.5× interquartile range, with outliers beyond. All dPCR measurements are single replicates. c Analysis of beta diversity in cecum samples at a series of 10× dilutions (n = 1 for each dilution). Mean Aitchison distance for six pairwise comparisons of n = 4 sequencing replicates of the undiluted (108 copies) sample (black) is shown for reference (error bar is standard deviation). Individual data points are overlaid on the replicates bar plot.

