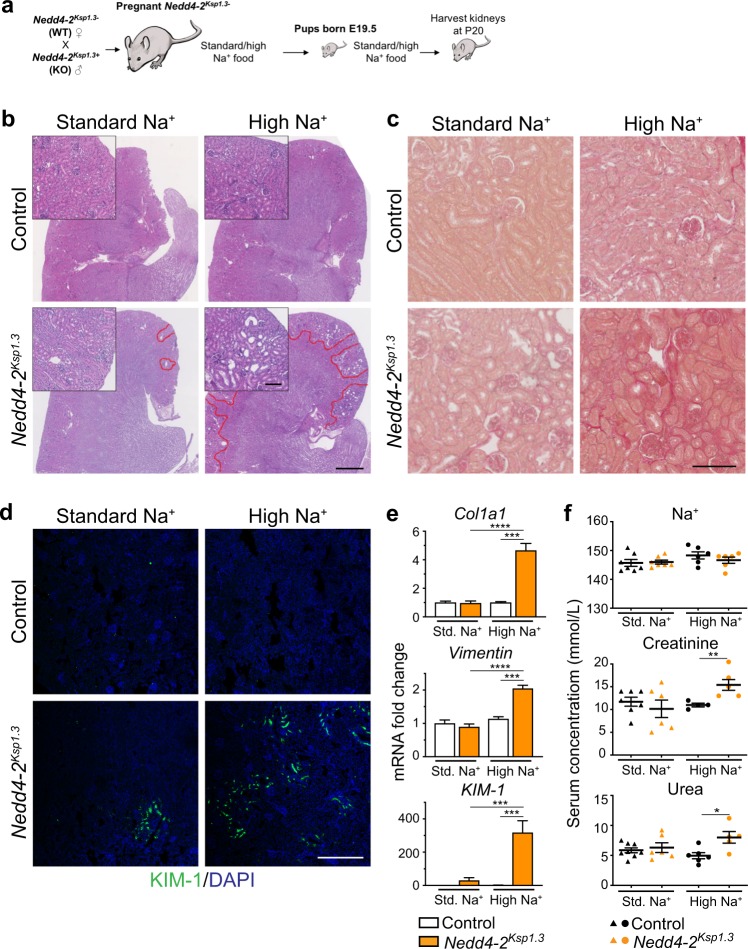
Fig. 1. High dietary Na+ exacerbates kidney pathology in Nedd4-2Ksp1.3 mice.
a Outline of salt-feeding experiments. b Representative H&E images show increase in kidney injury after high-Na+ diet in P20 kidneys. Red lines denote areas of damage. Scale bar: 1 mm, inset 100 µm. c Picrosirius red staining shows fibrosis after the high-Na+ diet in Nedd4-2Ksp1.3 kidneys. Scale bar: 100 µm. d KIM-1 staining shows small regions of injury in Nedd4-2Ksp1.3 kidneys under standard-Na+ diet, and extensive regions after high-Na+ diet. Scale bar: 250 µm. e qPCR for markers of kidney injury collagen I (Col1a1), vimentin and KIM-1 show the significant increases in Nedd4-2Ksp1.3 kidneys after the high-Na+ diet (n = 6–7 mice per genotype). Data are shown as fold change from control on standard (Std.) diet, mean ± SEM with significance calculated by a Student’s t test (two tailed). f Serum levels of Na+ remain unchanged, however, creatinine and urea are increased in Nedd4-2Ksp1.3 mice after the high-Na+ diet. Data are presented as one point per mouse, mean ± SEM with significance calculated by a Mann–Whitney test. *P < 0.05, **P < 0.01, *P < 0.005, **P < 0.001.

