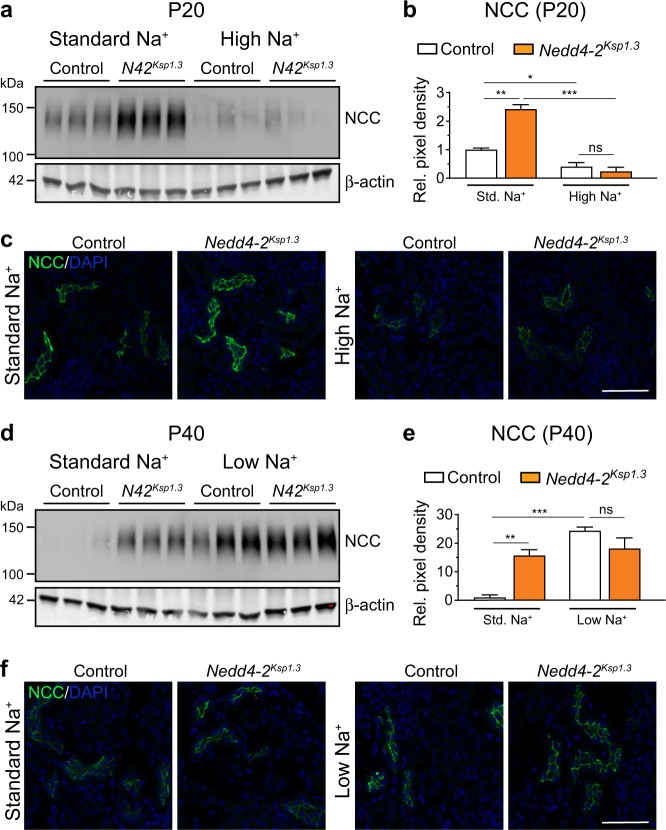
Fig. 5. Changes in NCC levels in response to varied Na+ diet.
a Semi-quantitative immunoblot analysis of P20 kidneys shows higher expression of NCC in Nedd4-2Ksp1.3 (N42Ksp1.3) kidneys under standard-Na+ diets, downregulated in both control and Nedd4-2Ksp1.3 kidneys after high-Na+ diet. Expression levels quantitated in b as fold change from control standard diet, relative to β-actin expression. c NCC has higher membrane expression in Nedd4-2Ksp1.3 kidneys at P20 on standard-Na+ diet, downregulated to a similar level in control and Nedd4-2Ksp1.3 kidneys after high-Na+ diet. d Semi-quantitative immunoblot analysis of P40 kidneys shows higher expression of NCC in Nedd4-2Ksp1.3 kidneys under standard-Na+ diet, upregulated in control and Nedd4-2Ksp1.3 kidneys after low-Na+ diet. Expression levels quantitated in e as fold change from control standard diet, relative to β-actin expression. f Higher membrane expression of NCC in Nedd4-2Ksp1.3 kidneys at P40 on standard-Na+ diet, upregulated to a similar level in control and Nedd4-2Ksp1.3 kidneys after low-Na+ diet. For graphs, n = 3, mean ± SEM with significance calculated by a Student’s t test (2 tailed). *P < 0.05, **P < 0.01, ***P < 0.005. Scale bar: 50 μm.

