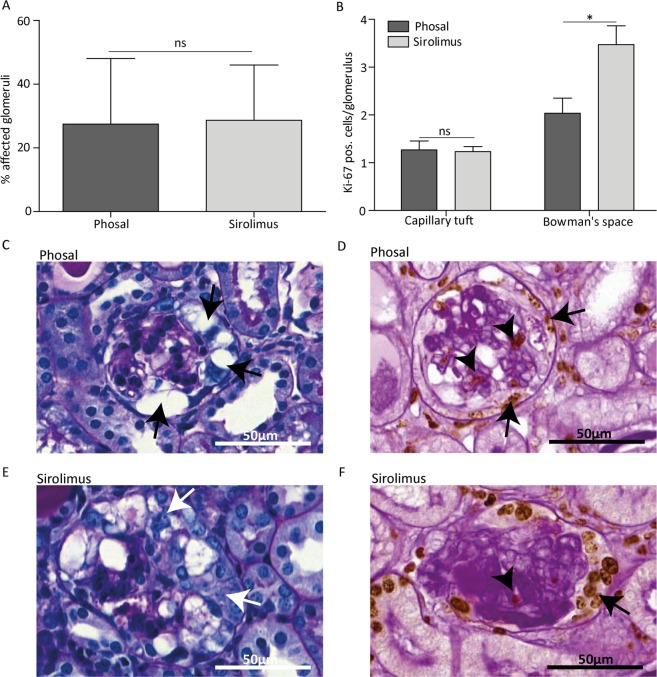
Figure 5.
Sirolimus does not reduce cell proliferation and sclerosis at day 7 in experimental FSGS. (A) Sirolimus treated anti-Thy1.1 mice showed no significant differences in the percentage of affected glomeruli compared to phosal treated mice. At least 55 glomeruli per mice were scored. Sirolimus treated mice n = 13, phosal treated mice n = 9. (B) Proliferation is expressed as ki-67 positive cells per glomerulus. Ki-67 positive cells were counted in at least 55 glomeruli per mouse. Sirolimus treated mice showed similar cell proliferation in the tuft and more cell proliferation in the Bowman’s space compared to phosal treated mice. Sirolimus treated mice n = 13, phosal treated mice n = 9. (C, E) Representative images of glomeruli stained with PAS of phosal and sirolimus treated mice. Black arrows indicate vacuolization of the glomerulus. White arrows indicate PEC proliferation. Hyalinosis deposits can be observed in the capillary tuft (dark violet). (D, F) Representative images of glomeruli stained with ki-67 (brown colour) and PAS without hematoxylin stain. Arrows indicate cell proliferation in the Bowman’s space, arrowhead indicates cell proliferation in the glomerular tuft. Dark violet colour in the capillary tuft indicates hyalinosis. Mean with SEM shown. *P ≤ 0.05, ns P ≥ 0.05.

