Figure 3.
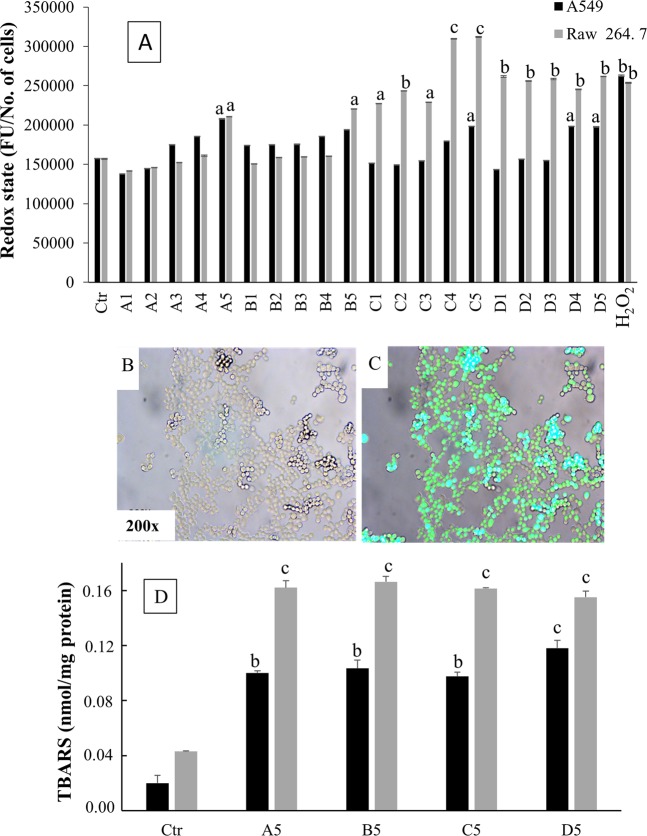
(A) Redox status assessed by means of DCF staining in A549 and Raw 267.4 cells. The redox status, expressed as intensity of DCF fluorescence, was evaluated in the two cell lines, either untreated (Ctr) or exposed for 3 h to varying concentrations either of slag powders with varying granulometry (A1–A5, B1–B5, C1–C5) or of untreated asbestos (D1–D5). H2O2 (100 µM) was tested as a positive control. The results are expressed as the average of fluorescence (FU)/number of cells and are the means ± SD of three independent experiments. Statistical analysis: aP < 0.05, bP < 0.01, and cP < 0.001 vs. control. (B,C) Representative microphotographs showing the effect of slag powders in Raw 267.4 cell lines, either unstained (B) or loaded with DCFH-DA (C). (D) TBARS levels, expressed as nmol/mg protein, in A549 and Raw 267.4 cells after contact for 12 h with the highest concentrations either of slag powders (15.62 µg/cm2) of different granulometries (A–C) or of asbestos. (D) The columns report the means + SD of triplicate analyses. Statistical analysis: bP < 0.01 and cP < 0.001 vs. controls.

