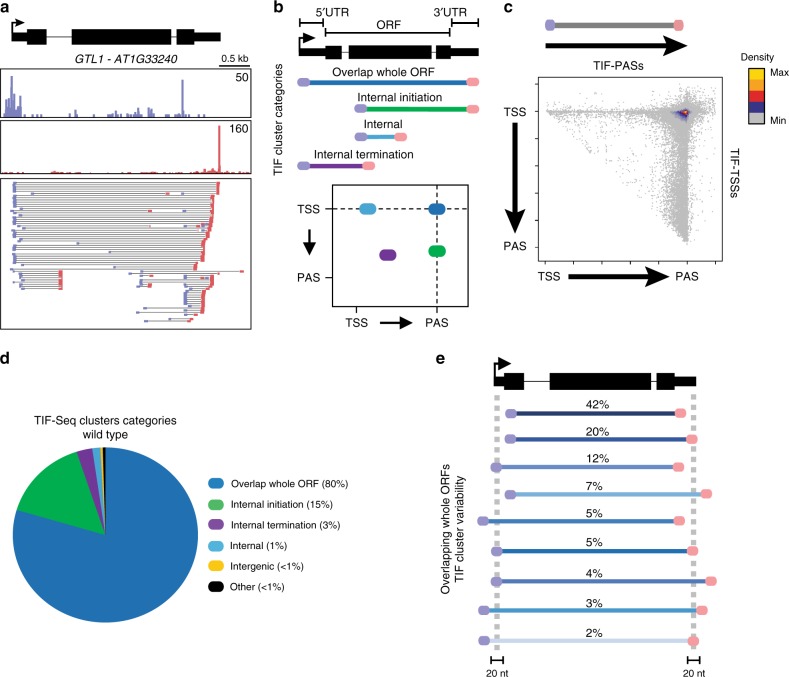
Fig. 1. Mapping TU boundaries in Arabidopsis by TIF-seq.
a Genome browser screenshot of TSSs (TSS-seq)35, PASs (Direct RNA-seq; DR-seq)73, TSS/PAS pairs (TIF-seq) and TIF-clusters at the GTL1 gene. b Schematic of TIF-TSS/PAS pairs representing different TIF-cluster categories and 2D illustration of these positions (blue circles are TSSs and red circles PASs) with respect to genome annotations. Each line and its colour correspond to the coloured circles in the schematic scatterplot. c Scatterplot of TIF-cluster TSS/PAS pairs in wild type. Each point represents one TIF-seq cluster and its TIF-TSS and PAS distance to respective annotated gene boundaries and normalised to gene length. The colour scale represents 2D position enrichment density of clusters from low (grey) to high (yellow). d Pie chart of TIF-cluster categories proportions present in wild type. e Schematic representation and percentage of subcategories for TIF-clusters overlapping whole ORFs. Source data of d and e are provided in the Source Data file.

