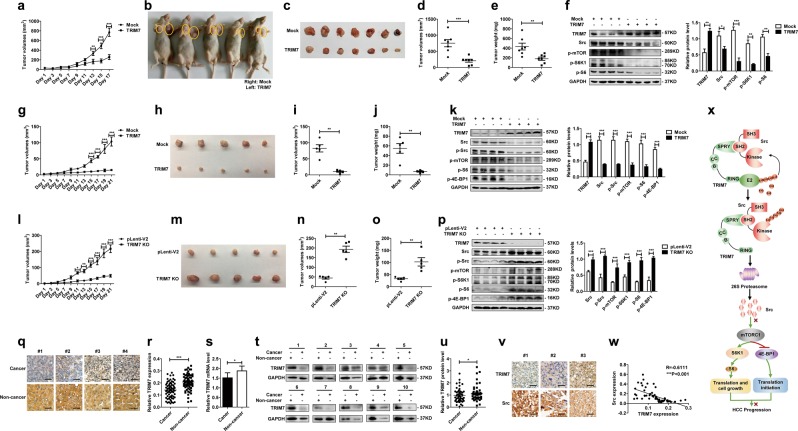
Fig. 7.
Xenograft tumor models and clinical HCC tissues validated the tumor suppressor role of TRIM7. a–f The Xenograft tumor model with TRIM7 plasmid injection was constructed as described before. When visible tumors appeared, 30 μg of TRIM7 plasmid or equal amount of mock control plasmid were injected into tumors in either flank once every other day. Tumors were measured every other day before the mice were sacrificed (a). Images were presented to show the representative of the mice with subcutaneous xenograft tumors in the TRIM7-transfected group and mock control group (b). Images were presented to show formed tumors isolated from sacrificed mice in the TRIM7-overexpressing group and mock control group (c). Statistical analysis of the volume (d) and weight (e) of formed tumors in the TRIM7-overexpressing group or mock control group. The protein levels of TRIM7 and the Src-mTORC1-S6K1 signaling in the TRIM7-overexpressing tumors and mock control tumors were detected by western blot (f). Band intensities of the key proteins were further quantitatively analyzed in the indicated groups and were presented in the right panel. g–k The TRIM7 stably overexpressing xenograft tumor model was constructed by subcutaneously injecting 1 × 10⁷ TRIM7 stably overexpressing Huh7 cells into one flank of athymic nude mice, and injecting equal amount of mock control cells into the other flank of the athymic nude mice. Growth curves of the TRIM7 stably overexpressing tumors and mock control tumors were monitored every other day before the mice were sacrificed (g). Images were presented to show the formed tumors isolated from the TRIM7 stably overexpressing group and mock group (h). The volume (i) and weight (j) of the formed tumors in the TRIM7 stably overexpressing group and mock control group were statistically analyzed. The protein levels of TRIM7 and the Src-mTORC1-S6K1 signaling in the TRIM7 stably overexpressing tumors and mock control tumors were analyzed by western blot, and intensities of the key proteins were further quantitatively analyzed and were presented in the right panel (k). l–p The TRIM7-knockout xenograft tumor model was constructed by injecting 1 × 10⁷ TRIM7-knockout cells into one flank of the nude mice and equal amount of control cells into the other side of the mice. The formed tumors were measured every other day before the mice were sacrificed (l). Images were presented to show the formed tumors isolated from the sacrificed mice in the TRIM7-knockout tumors and mock control tumors (m). The volume (n) and weight (o) of formed tumors in the TRIM7-knockout group and mock control group were statistically analyzed. The protein levels of TRIM7 and the Src-mTORC1-S6K1 signaling in the TRIM7-knockout tumors and mock control tumors were analyzed by western blot (p). Band intensities of the key proteins were further quantitatively analyzed in the indicated groups and were presented in the right panel. q IHC staining of TRIM7 in HCC tissues and corresponding noncancerous liver tissues from clinical HCC patients. Presented images are representative of figures from the investigated HCC patients. r Statistical analysis of TRIM7 expression by IHC assay in HCC tissues and corresponding noncancerous liver tissues from the investigated HCC patients. s Real-time PCR analysis of TRIM7 mRNA level in HCC tissues and corresponding noncancerous liver tissues from clinical HCC patients. t Western blot analysis of TRIM7 protein level in HCC tissues and corresponding noncancerous liver tissues from clinical HCC patients. Presented images are the representative of blots from the investigated HCC patients. u Statistical analysis of TRIM7 expression by western blot assay in HCC tissues and corresponding noncancerous liver tissues from the investigated HCC patients. v IHC staining of Src expression in HCC tissues from clinical HCC patients. Presented images are representative of figures from the investigated HCC patients. w Correlations analysis of TRIM7 and Src expression by IHC assay in HCC tissues from the investigated HCC patients. x Schematic illustration of the interaction between TRIM7 and Src proteins, as well as the related signaling pathway. *P < 0.05, **P < 0.01, and ***P < 0.001 for statistical analysis of the indicated groups. Scale bar in q, v: 50 μm

