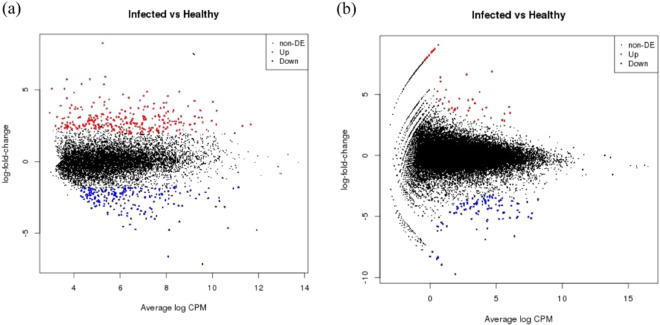
Figure 1.
MA-plot of differential expression for (a) Vitis vinifera and (b) Nicotiana benthamiana, M-values, i.e. the log of the ratio of level counts for each gene between two samples against A-values. A-values, i.e. the average level counts for each gene across the two samples. (a) GLRaV-3 infected V. vinifera versus healthy V. vinifera. (b) GLRaV-3 infected N. benthamiana versus healthy N. benthamiana. Figure key: Non-DE, UP, and Down refer to Non-differentially expressed genes (black), Up regulated genes (red), and Down regulated genes (blue), respectively.

