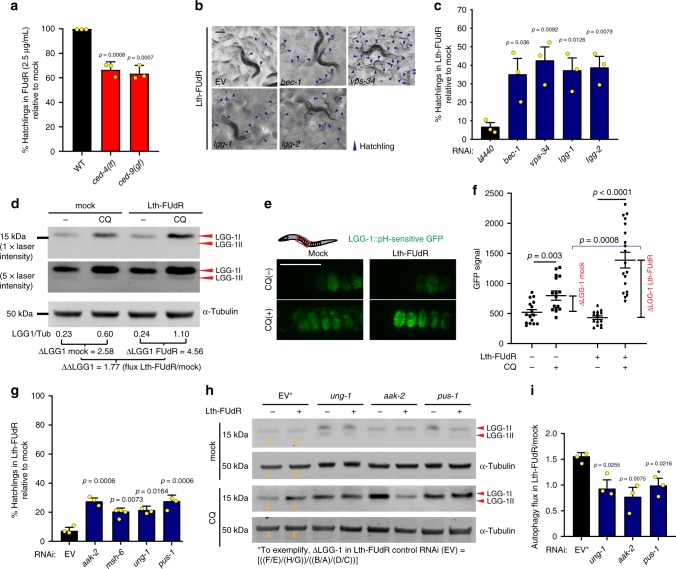
Fig. 5. Lth-FUdR activates autophagic cell death in C. elegans.
Throughout this figure: % hatchlings was analyzed as described in Fig. 1. Statistical significance was assessed via two-tailed unpaired nonparametric t-test for % hatchlings quantification. Statistical significance for western blotting ratio was assessed via one-tailed ratio t-test. Data are presented as mean values ± SEM, n = # independent biological replicates. Source data are provided as a Source Data file. a Quantification of progeny viability of WT, ced-4(n1162), and ced-9(n1950) mutant C. elegans exposed to 2.5 μg/mL FUdR (lower dose of FUdR used to enable detection of enhancers). n = 3. b Representative images of progeny viability of C. elegans exposed to Lth-FUdR while cultured on EORB1 EV or autophagy RNAi clones. Scale bar = 200 µm. c % hatchling quantification of treatments represented in b. n = 3. d Representative αLGG-1 western blotting of worms cultured on EORB1 lawn ±Lth-FUdR (7.5 μg/mL) ±8 h exposure to 20 mM chloroquine (lysosomal inhibitor). Two different exposures of αLGG-1 blot are depicted. Autophagy flux estimation and data interpretation described in main text and Methods. n = 10. e In vivo imaging of embryos expressing LGG-1::GFP(pH-sensitive) treated with ±Lth-FUdR (7.5 μg/mL) and ±8 h of 20 mM chloroquine. Scale bar = 100 μm. f Quantification of GFP signal of treatments represented in e, two-tailed, unpaired, nonparametric t-test. LGG-1::GFP data acquisition, analyses, and interpretation described in main text and Methods. Unpaired nonparametric one-tailed t-test was used to singly compare average GFP signal in (+)CQ to (−)CQ (denoted with black brackets and asterisks), and one-tailed ratio t-test was used to compare ∆LGG-1 ratios (denoted with blue brackets and asterisks). n = 3. g Quantification of progeny viability of C. elegans exposed to Lth-FUdR (7.5 μg/mL) while cultured on EORB1 EV or RNAi against aak-2, msh-6, ung-1, or pus-1. n = 3. h Representative αLGG-1 western blotting of worms cultured on EORB1 EV or RNAi against ung-1, aak-2 or pus-1 ± Lth-FUdR (7.5 μg/mL) ±8 h of 20 mM chloroquine. Approach, data analyses, and interpretation described in main text and Methods. i Autophagy flux quantification as depicted in h, and described in Methods. n = 3.

