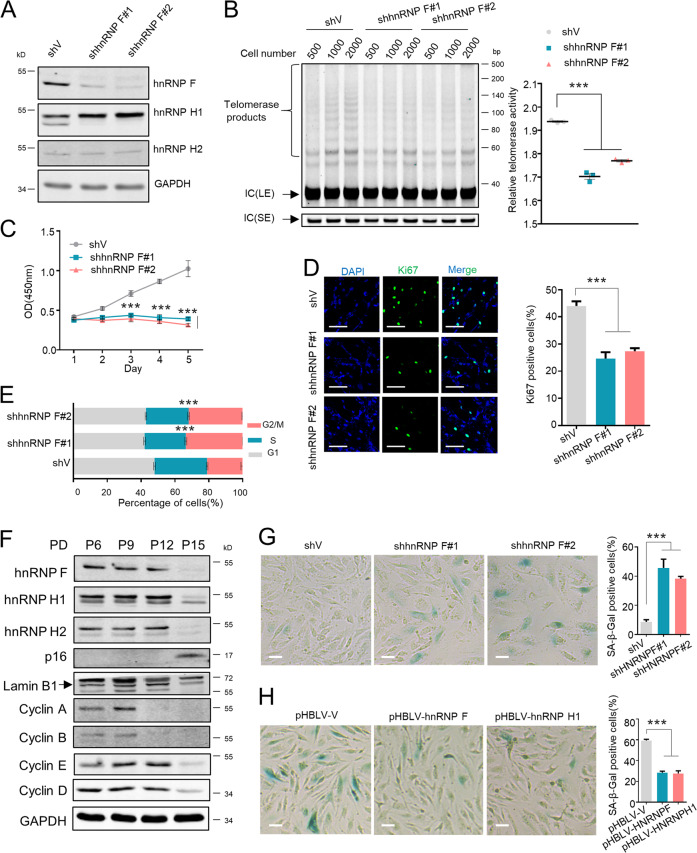
Fig. 7. HnRNP F knockdown represses hMSCs telomerase activity and cell proliferation, and promotes cell senescence.
a hMSCs cells stably expressing pLKO.1-vector or pLKO.1-hnRNP F (#1 or #2) were generated and hnRNP F knockdown was confirmed by WB analysis. Then the stable hMSCs cell lines were used to perform following assays: b TRAP assay, data were quantified and graphed. Error bars represent means ± SD (n = 3). Statistical analysis was performed using Student's t test (***P < 0.001); c CCK-8 cell proliferation assay, error bars represent means ± SD (n = 3). Statistical analysis was performed using Student's t test (***P < 0.001); d Cells were stained for Ki67 using anti-Ki67 antibody (green), and nuclei (DAPI, blue). Representative immunofluorescent images are shown. Scale bar, 100 μm. The experiments were repeated three times. Data were quantified and graphed. Error bars represent means ± SD (n = 3). Statistical analysis was performed using Student's t test (*** P < 0.001); e Cell cycle analysis, error bars represent means ± SD (n = 3). Statistical analysis was performed using Student's t test (***P < 0.001). f hMSCs cells passaged over time and cell lysates of different PDs were subjected to the WB analysis for the indicated proteins. g hMSCs cells described in a were assessed by SA-β-gal activity assay. Scale bar, 10 μm. Data were quantified and graphed. Error bars represent means ± SD (n = 3). Statistical analysis was performed using Student's t test (*** P < 0.001). h hMSCs cells stably expressing pHBLV-vector or pHBLV-hnRNP F or H1 were subjected to the SA-β-gal activity assay. Scale bar, 10 μm. Data were quantified and graphed. Error bars represent means ± SD (n = 3). Statistical analysis was performed using Student's t test (***P < 0.001).

