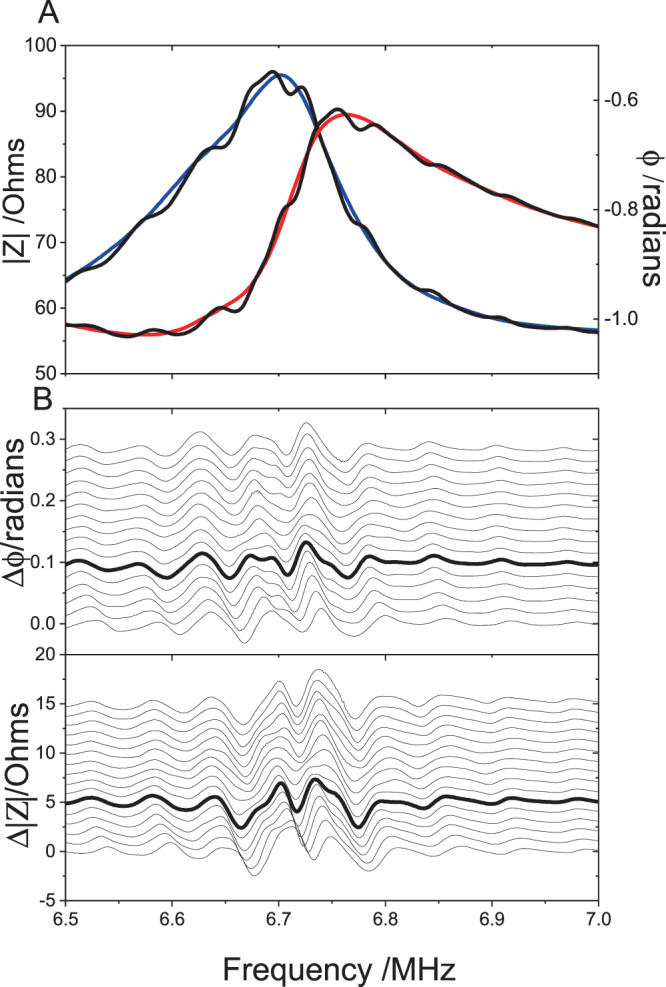
Figure 8.

(A) The electrical impedance |Z | (red line) and phase angle φ (blue line) for the two transducers connected in parallel for the device before filling. The black lines show the corresponding impedance when water is added to the cell. The modulation of the impedance with a period of ~60 kHz, due to cavity resonance, is observed clearly. (B) The changes in the modulation seen in the impedance measurements as the volume of water is increased successively in 20 µL steps. The lowest trace corresponds to the underfilled device. The bold line corresponds to a level surface in the device as used in our measurements. For clarity the smooth unfilled cell impedance (red and blue lines in (A) has been subtracted and the measurements offset by +0.05Ω ( | Z | ) and +0.001 radians (φ) for each step. The large variations in the impedance close to the operating frequency of the device (6.77 MHz) can be observed.
