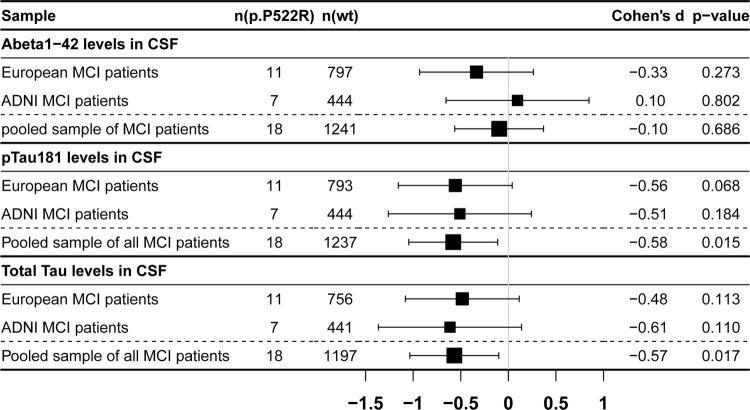
Fig. 3.
Associations of p.P522R with CSF biomarkers of Alzheimer’s disease (AD). Black dots and arrows represent Cohen’s d estimates and 95% confidence interval, respectively. For Aβ1-42, negative Cohen’s d estimates indicate more pathology. In the case of pTau181 and tTau, positive Cohen’s d values represent more pathology. N(p.P522R) number of p.P522R carrier, n(wt) number of p.P522R non-carrier, Aβ1-42 amyloid-beta 1-42, pTau181 phosphorylated tau

