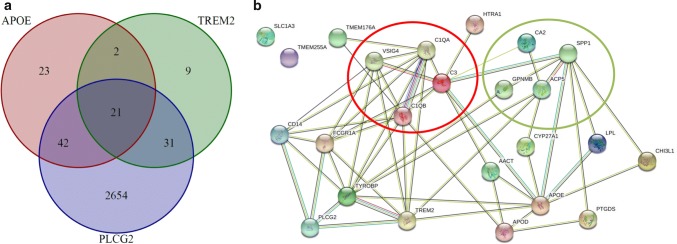
Fig. 5.
Co-regulatory network shared between APOE, TREM2, and PLCG2. a Venn diagram showing the number and the overlap of genes highly co-expressed APOE, TREM2, and PLCG2. b Depiction of potential relationships between genes included in the shared co-expression network of APOE, TREM2, and PLCG2. The red circle marks members of the complement cascade. The green circle marks genes involved in tissue remodeling. Green lines between proteins indicate evidence for interaction based on text mining, black lines represent co-expression, blue lines indicate evidence from curated databases, and magenta lines indicate experimentally conformed interactions

