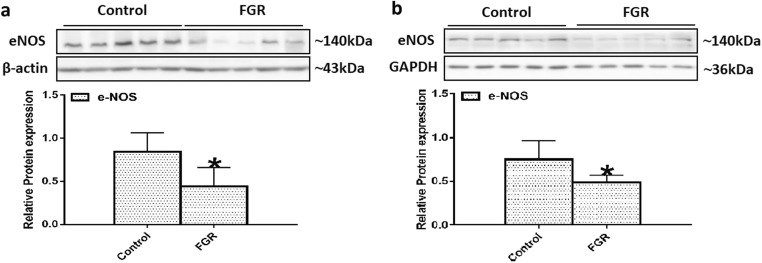
Fig. 5.
Expression of eNOS in the placental and umbilical cord tissues. Protein bands of eNOS in the placental (a) and umbilical cord (b) tissues were examined by Western blot analysis (n = 5 per group). β-Actin and GAPDH were used as internal references. Values are expressed as mean ± SD. *P < 0.05 compared with “control”

