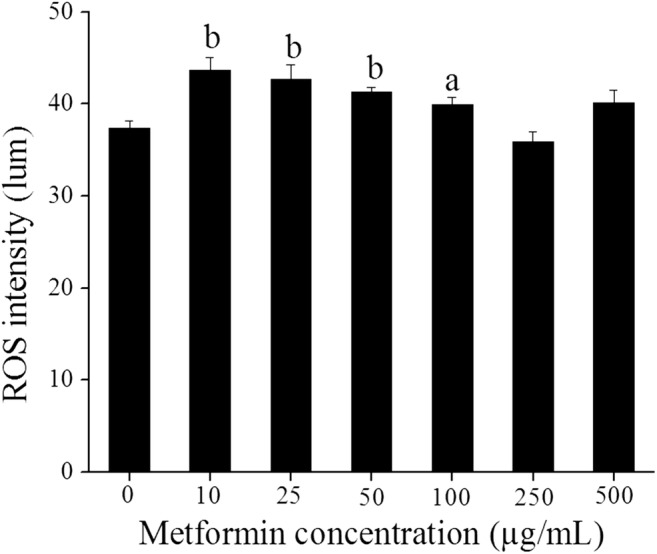
Fig. 5.

The effect of in vitro treatment of metformin on the ROS level in MII oocytes. MII oocytes obtained from post-IVM of GV oocytes exposed to different concentrations of metformin (0, 10, 25, 50, 100, 250, and 500 μg/mL) were incubated with 10 μM DCFDA in DMEM for 30 min at 37 °C and 5% CO2. The oocytes were washed and visualized under a fluorescent microscope. The images were captured and ROS intensity was measured using Q-capture software. The intensity corresponds to the ROS level in the oocytes and expressed as lum units. The data was represented as mean ± SE (n = 150, 54, 58, 151, 148, 135, and 98 MII oocytes for 0, 10, 25, 50, 100, 250, and 500 μg/mL group respectively). aP < 0.01, bP < 0.001 compared with the control group
