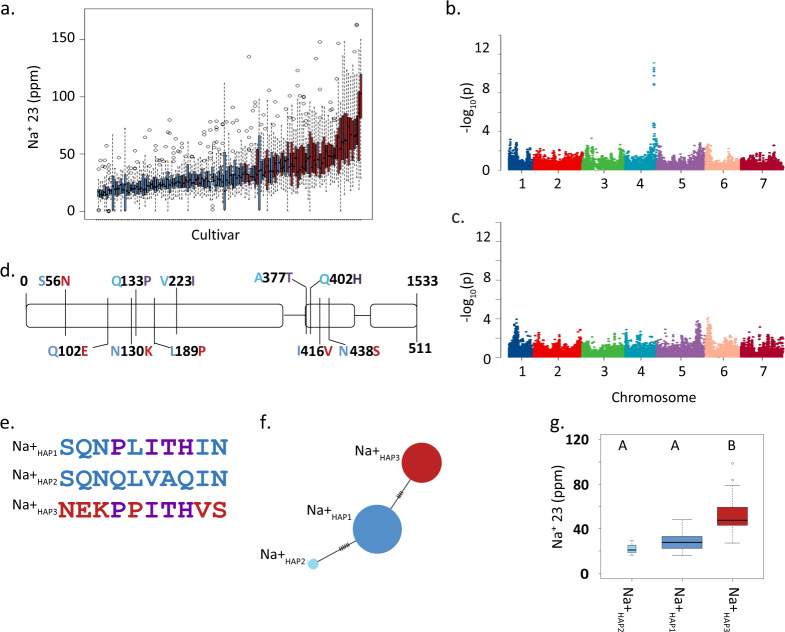
Fig. 1. HvHKT1;5 haplotypes influence grain Na+ content.
a Box plots of of grain sodium content quantified using ICP-MS, n = 5 biologically independent samples. Blue bars represent lines containing L189 and red bars represent genotypes containing P189. b Manhattan plot of GWAS of grain Na+ 23 content, FDR threshold = −log 10(P)=6.02. c Manhattan plot of GWAS of grain K+ content using, FDR threshold = −log 10(P)=6.02. d Gene structure and nonsynonymous polymorphisms coloured according to haplotype shown in e. e. Haplotype summary based on nonsynonymous SNPs. f Haplotype analysis of nonsynonymous SNPs. Circles scaled to number of individuals sharing the haplotype, and short lines represent number of SNPs differentiating haplotype groups. g Box plots of grain Na+ contents in the three haplotypes, n = 3, 73, and 41, width of plots scaled to number of individuals from each haplotype. Different letters above boxes indicate significant difference in grain sodium content p < 0.05, same letters indicate no significant difference using this threshold. For both sets of boxplots the horizontal bar of the boxplot shows the median, the box delineates the first and third quartile, and the whiskers show ±1.5 × IQR.

