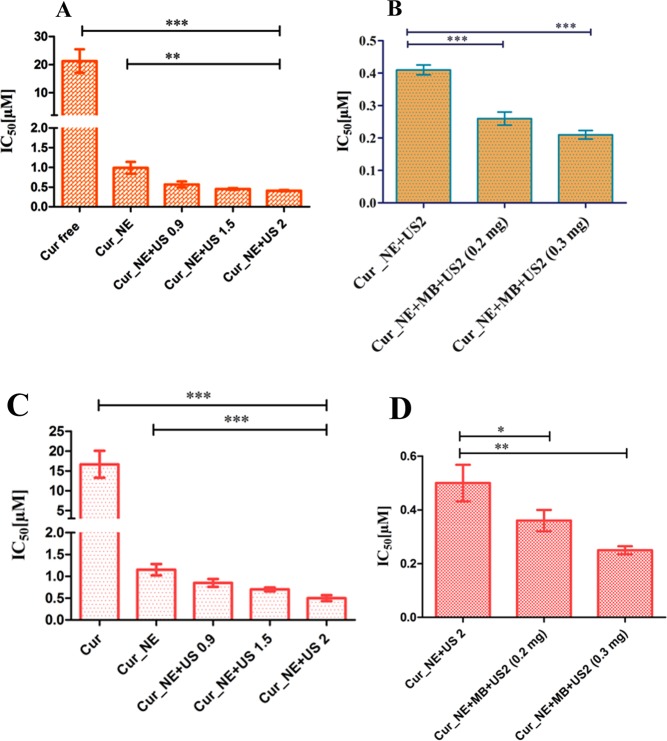
Figure 6.
The IC50 concentration of the Cur_NE following ultrasound exposure at intensity 0.9, 1.5 and 2 W/cm2 in (A) MDA MB 231 cells, **P ≤ 0.01, ***P ≤ 0.001 (C) B16F10 cells, ***P ≤ 0.001. The IC50 concentration of the Cur_NE at ultrasound intensity 2 W/cm2 in presence of 0.2 and 0.3 mg of MB in: (B) MDA MB 231, ***P ≤ 0.001 (D) B16F10 cells, *P ≤ 0.05, **P ≤ 0.01. Data are presented in the form of mean ± SD and P value was determined by Student t-test.

