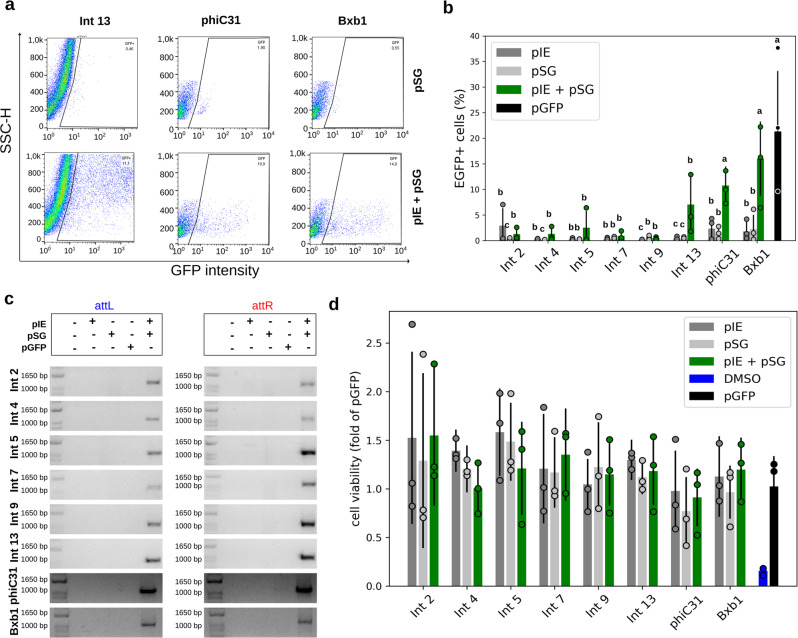
Fig. 2. Functional characterization of the genetic switches in human cells.
a Flow cytometry distribution of HEK 293T cells at 48 h post transfection for Ints 13, phiC31, and Bxb1, the integrases that led to the highest EGFP-expressing cell frequencies. The heat map indicates the scattering of high cell concentrations (warm colors) to low cell concentrations (cool colors). The gate encompasses the EGFP-expressing cell population. b Bar graph plots showing the total average percentage and standard deviation of a cell population expressing EGFP in biological repeat assays (n = 3) and circles showing the technical duplicate or triplicate average of each assay on the y axis. The x axis contains the different conditions. For each Int data group, different letters indicate significant differences (p < 0.05). c Amplicons obtained through PCR analysis using two specific primer sets, the first set to verify attL formation and the second set to verify attR (highlighted in Fig. 1). The expected amplicon sizes in the Int test groups varied from 1021 to 1104 bp for attL and from 1058 to 1084 bp for attR. d Bar graph plots showing the viable cells average (circles corresponding to technical replicates averages) and standard deviation normalized with pGFP of OD measurements obtained after MTT assays (n = 3). DMSO corresponds to the impairment negative control. Negative control cells were transfected with only one of the two vector sets, that is, integrase expression (pIE) or switch GFP (pSG) vectors. Positive control cells (pGFP) have an egfp sequence in the forward orientation under the control of the EF1 alpha promoter. All the data are representative of two or three technical and three biological replicates.

