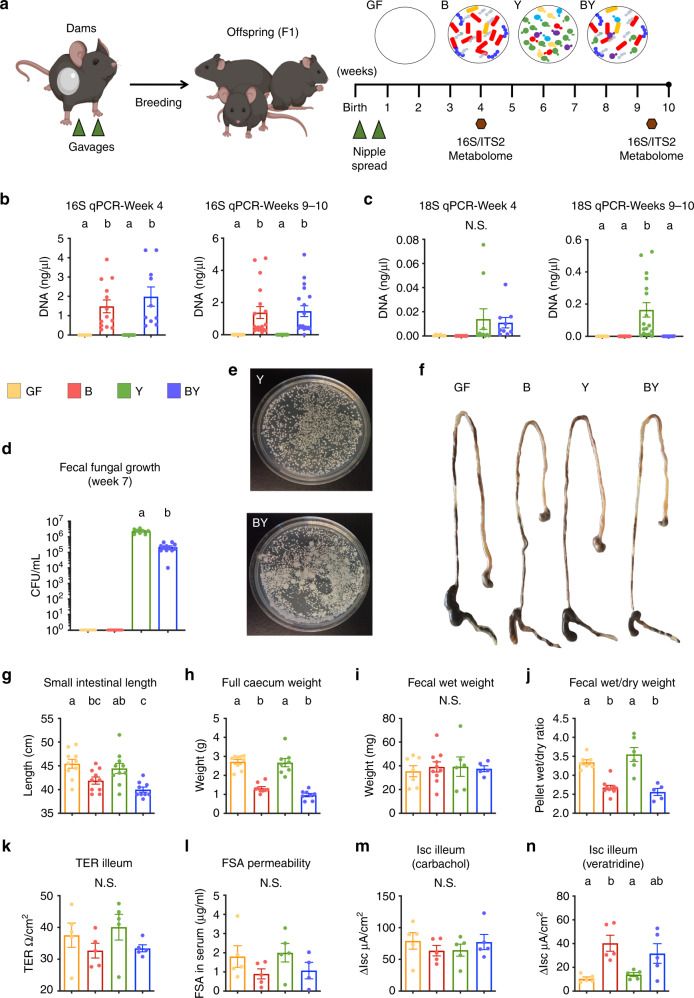
Fig. 1. Bacterial colonization is essential to induce intestinal anatomical and functional changes of colonized mice.
a Experimental layout for gnotobiotic study. Germ-free dams were orally gavaged twice with a consortium of 12 bacteria (B), 5 yeasts (Y), a combination of both (BY), or kept germ-free (GF). F1 mice were further colonized during the first week of life (see Methods and Supplementary Table 1). Fecal samples (hexagons) were obtained at 4 and 9–10 weeks of age for microbiota quantification (qPCR), taxonomic analysis (16S and ITS2 sequencing), and functional characterization (metabolome). qPCR quantification (standard curve method) of b bacterial and c fungal DNA in fecal samples by amplification of the 16S and 18S rRNA genes, respectively. d Fecal fungal colony counts in YM agar media supplemented with antibiotics (gentamycin + chloramphenicol). e Fecal fungal growth in selective medium from representative Y and BY mice. f Representation of gross anatomic changes of dissected gastrointestinal tracts across groups (stomach to distal colon). g Small intestine length and h full cecum weight of gnotobiotic dams at around 20 (17–25) weeks of age. i Water content in fecal samples measured by total fecal weight and j wet/dry ratio in dams. Gut barrier function measured by k ileal transepithelial resistance (TER) and l clearance of fluorescein-5(6)-sulfonic acid (FSA) over 4 h. Ileal short-circuit current (ΔIsc) upon stimulation with m epithelial stimulator carbachol or n neurostimulator veratridine. Data expressed as mean ± S.E.M. b–d, g–j Color denotes colonization treatment (GF = yellow, B = red, Y = green, BY = royal blue); b, c Data combined from two different experiments, Week 4: NGF = 5, NB = 13, NY = 13, NBY = 11; Week 9: NGF = 13, NB = 18, NY = 19, NBY = 19; d NGF = 5, NB = 6, NY = 8, NBY = 12; g NGF = 10, NB = 10, NY = 10, NBY = 9; h NGF = 10, NB = 9, NY = 8, NBY = 8; i, j NGF = 7, NB = 10, NY = 6, NBY = 5; k, m, n NGF = 5, NB = 5, NY = 5, NBY = 5; l NGF = 5, NB = 5, NY = 5, NBY = 4; different letters above bars indicate statistically significant differences defined by one-way ANOVA and Tukey post hoc tests (a–c, g–j) or two-sided t-test (d); P < 0.05; N.S. no significant differences. Source data are provided as a Source data file.

