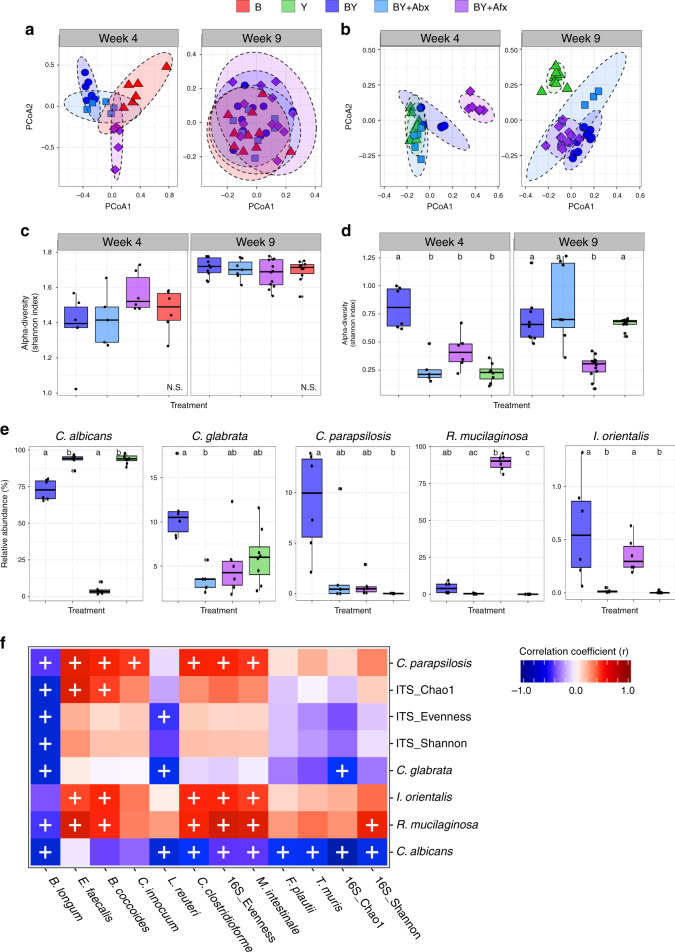
Fig. 3. Fungal colonization and antimicrobial treatments influence gut microbiome ecology.
Ecological community analyses of 16S and ITS2 sequences. PCA ordination of variation of a bacterial or b fungal beta-diversity of mice gut microbial communities based on Bray–Curtis dissimilarities among samples across treatments and experimental time points. Plots of c bacterial or d fungal alpha-diversity (Shannon index) across groups. e Relative abundances of fungal species at 4 weeks. a–e Color denotes colonization treatment (B = red, Y = green, BY = royal blue, BY + Abx = cyan blue, BY + Afx = purple); Week 4: NB = 6, NY = 8, NBY = 6, NAbx = 5, NAfx = 6; Week 9: NB = 10, NY = 11, NBY = 10, NAbx = 7, NAfx = 12; c–e Boxplots indicate median (inside line) and 25th and 75th percentile as the lower and upper hinges, respectively; different letters above bars indicate statistically significant differences defined by Kruskal–Wallis with post hoc Dunn tests and FDR corrected; P < 0.05; N.S. no significant differences. f Heat map of biweight correlations between bacterial (y-axis) and fungal species (x-axis) in feces collected at 4 weeks of age. Color denotes positive (red) and negative (blue) correlation values. Significant correlations are denoted with a cross and defined by the BiCOR method with FDR correction; P < 0.05. Source data are provided as a Source data file.

