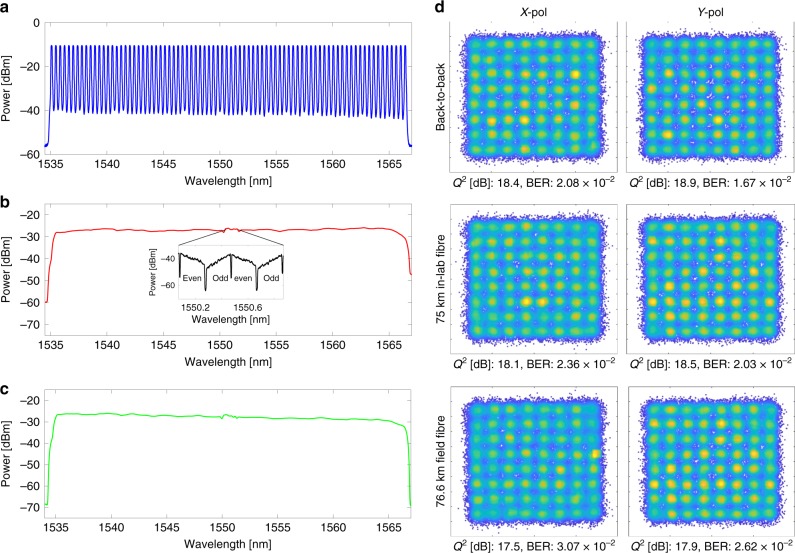
Fig. 3. Soliton crystal super-channel spectra, and indicative signal constellations.
a–c Spectra of the soliton crystal frequency comb after flattening a, modulation and transmission through either 75 km spooled in-lab fibre b or through the field-trial link c. The spectrum a is measured with 12.5 GHz resolution to resolve the individual comb lines, whereas b and c are plotted at 50 GHz resolution to illustrate average channel powers. Flattening equalised the comb line power to within 1 dB. After modulation and amplification, the channels were shaped by the EDFA gain spectrum. The inset in b depicts the test channel spectra captured with a 150 MHz resolution optical spectrum analyser (Finisar WaveAnalyzer), highlighting the odd and even sub-bands modulated onto each comb line in the test band. d Constellation diagrams for a comb line at 193.4 THz (1550.1 nm) for both X- and Y-polarisation channels. ‘Back-to back’ denotes the transmitter directly connected to the receiver, ’75 km in-lab fibre’ indicates reception after transmission through 75 km of spooled fibre inside the lab (as per b), whereas ’76.6 km field fibre’ denotes reception after transmission through the field-trial link (as per c). BER and Q2 related to the constellations are noted on each.

