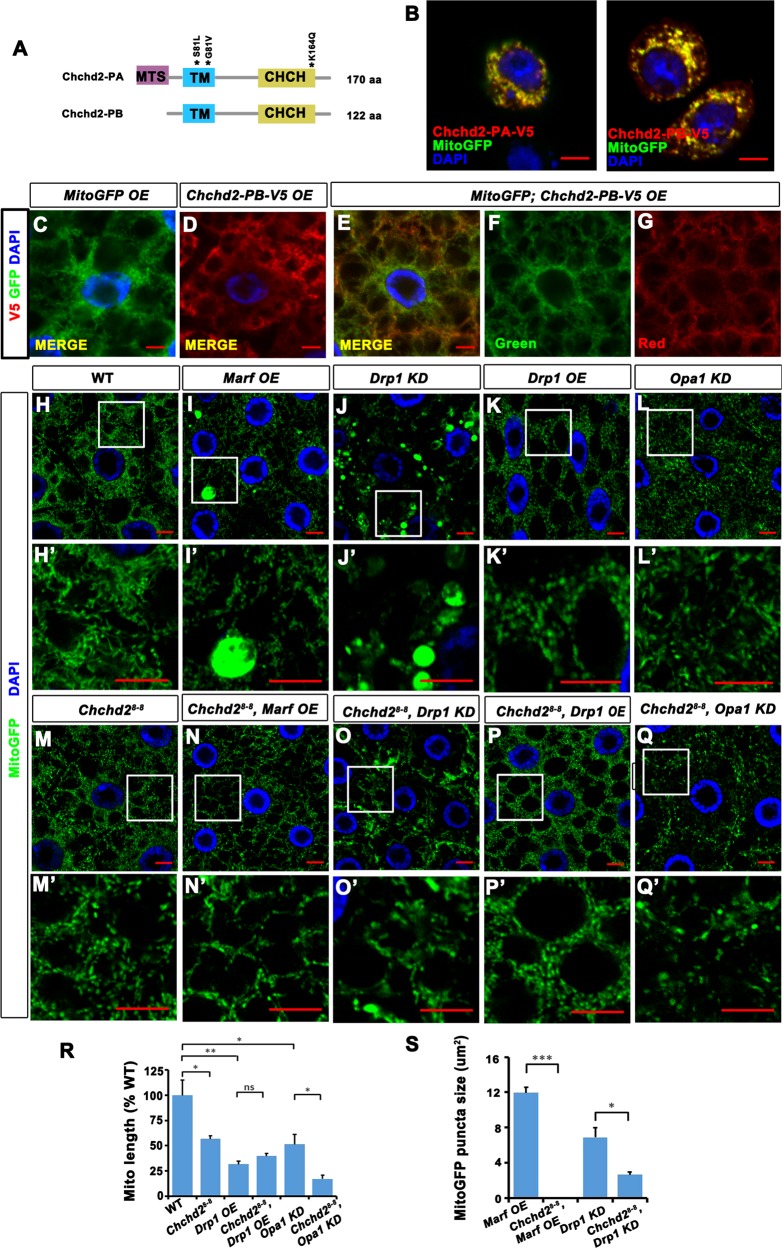
Fig. 3. The mitochondria were fragmented in Chchd28-8 mutants.
a A diagram showed the domain organization in two isoforms of Chchd2 proteins. MTS: mitochondrial targeting sequence. TM: transmembrane domain. CHCH: CHCH motif. b Both PA-Chchd2 and PB-Chchd2 (red) are co-localized with MitoGFP (green) when they were overexpressed in S2 cells. The bar indicates 5 μm. c–g PB-Chchd2 co-localized with MitoGFP when it was overexpressed in fat body tissues. c Fat body cells with MitoGFP (green) overexpression. d Fat body cells with PB-Chchd2 (red) overexpression. e, f Fat body cells with MitoGFP (green) and PB-Chchd2 (red) co-expressed. g and f are split channels of e. h–q’ The patterns of MitoGFP (green) in the fat body tissues of early third instar larvae with indicated genotypes. h’–l’ are the high magnification images of the boxed regions in h–l. Chchd28-8 fat body tissues have fragmented mitochondria (comparing m, m’ with h, h’). Over-expression (OE) of Marf (i and i’) or RNAi knock down (KD) Drp1 (j and j’) led to swollen mitochondria exhibit as large MitoGFP puncta, which are disappeared when Chchd2 was lost (n, n’, o, and o’). Drp1OE (k, k’) and Opa1 KD (l, l’) led to fragmented mitochondria. Loss of Chchd2 did not further enhance Drp1OE phenotypes (p, p’), but further reduced mitochondrial size of the Opa1 KD animals (q, q’). The bar indicates 5 μm. r, s The statistics of mitochondrial length and the MitoGFP puncta size of the animals with indicated genotypes. n = 4–7 images from 4 to 7 flies of each genotype have been analyzed. The data were presented as mean + SEM. ns, not significant; *p < 0.05; **p < 0.01; ***p < 0.001.

