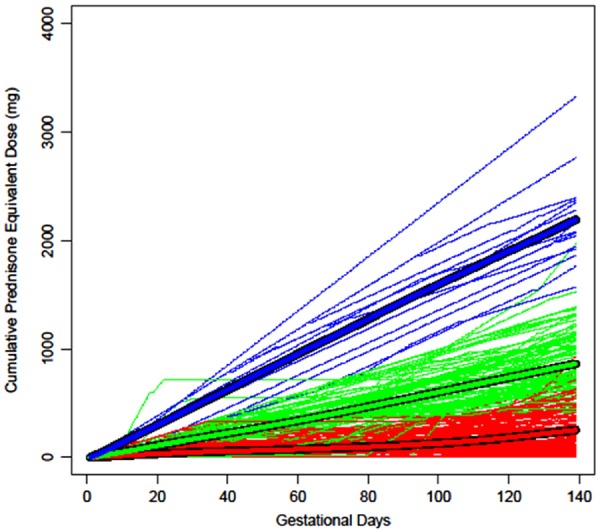
Fig. 2.

Oral corticosteroid cumulative dose trajectories between the last menstrual period and gestational day 139 (n = 254)
The thick lines represent the mean cumulative dose on each gestational day for each group and the thin lines represent each woman’s observed trajectory; blue = high, green = medium and red = low dose trajectories.
