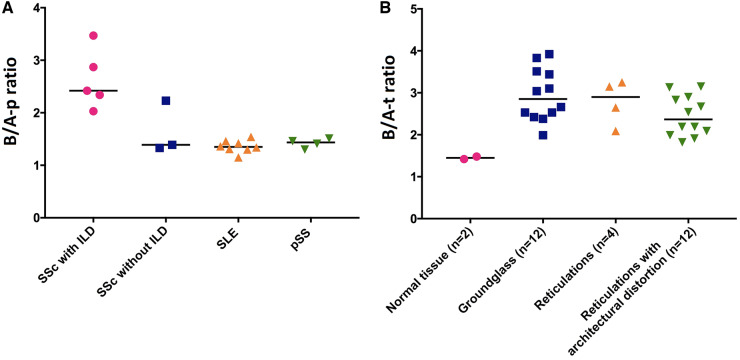
Fig. 3.
B/A-p and B/A-t ratios
(A) Mean values of B/A-p ratios were: SSc with ILD: 2.63; SSc without ILD: 1.65; SLE: 1.36; pSS: 1.42. The B/A-p ratio was higher in patients with ILD compared with patients without ILD, SLE patients and pSS patients (P = 0.07, P = 0.002 and P = 0.02, respectively). (B) Mean values of B/A-t ratios were: normal lung parenchyma: 1.45; ground glass: 2.95; reticulation: 2.79; reticulation with architectural distortion: 2.45. The B/A-t ratio was significantly higher in areas of ground glass and in areas of reticulation with architectural distortion compared with normal lung parenchyma (P = 0.02 and P = 0.02, respectively), but not in areas of reticulation without architectural distortion (P = 0.13). Statistic test: Mann-Whitney U-test. B/A-p ratio: basal/apical ratio at patient level; B/A-t ratio: basal/apical ratio at tissue level; ILD: interstitial lung disease; SUVmean: mean SUV.

