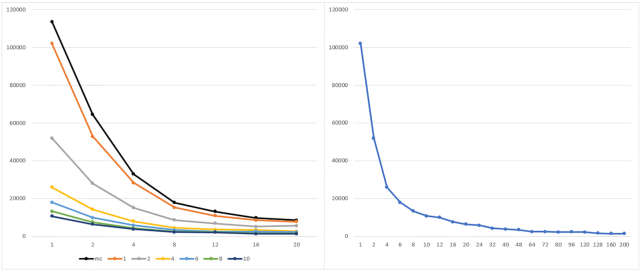
Figure 6:
Execution time of parSMURF1 and parSMURFn on the synthetic dataset synth_3. Left: The x-axis shows the number of threads for each MPI process; the y-axis, execution time in seconds. Experiments are grouped by the number of MPI processes. The black line represents the multi-thread version, while orange, grey, yellow, light blue, green, and blue show the MPI version with 1, 2, 4, 6, 8, and 10 MPI processes, respectively. Right: Results are grouped by total number of threads (n.thr × n.proc). When a combination is obtainable in >1 way only the best time is considered.

