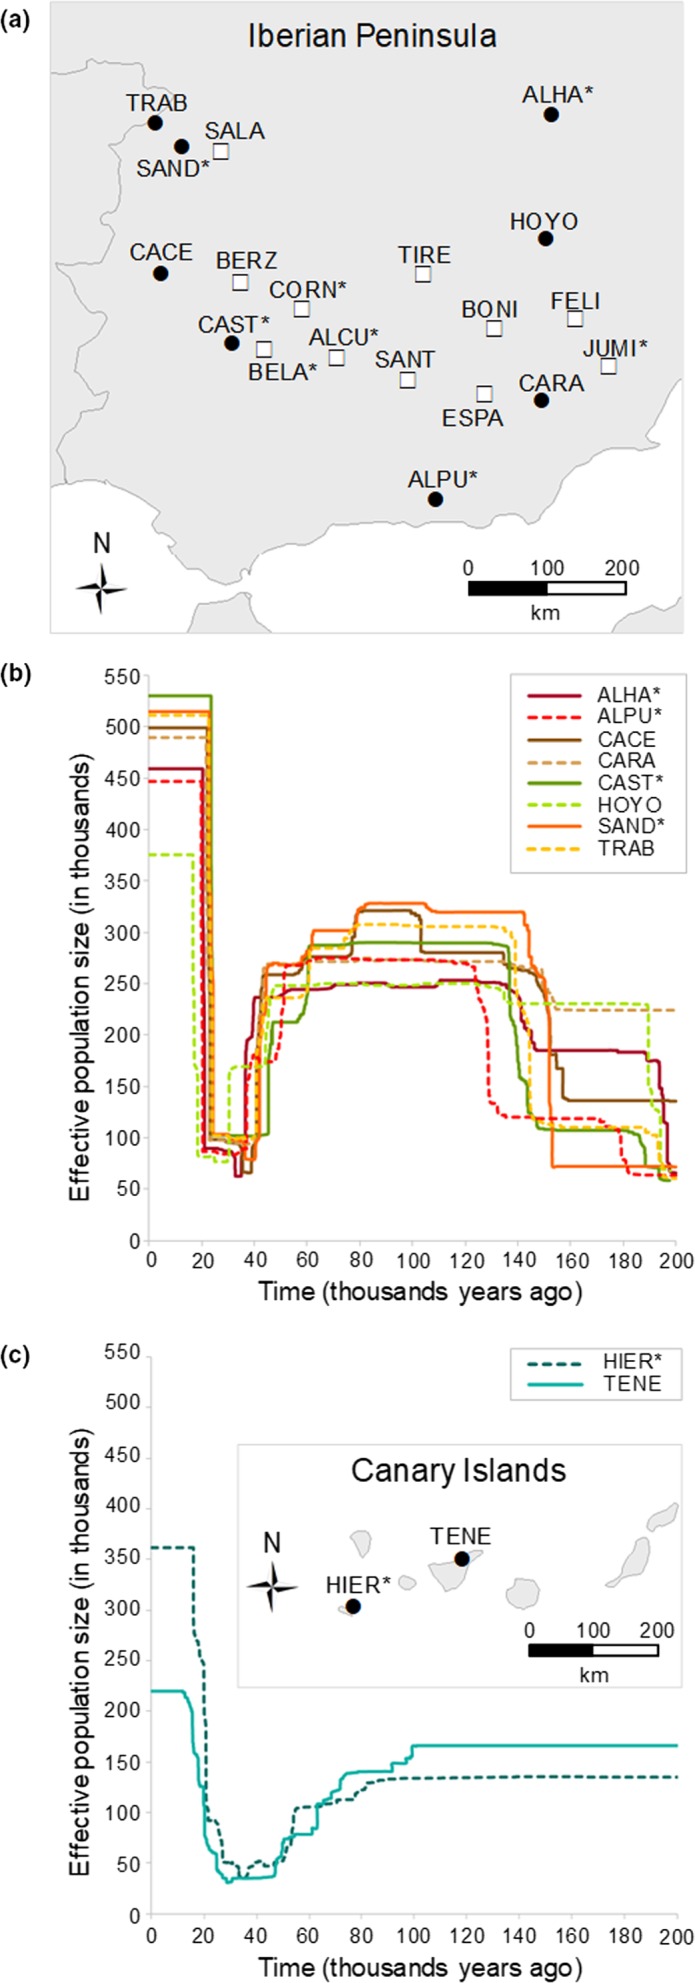
Figure 2.

Geographic location of the studied populations of Moroccan locust in (a) the Iberian Peninsula and (c) the Canary Islands. Black dots indicate those populations analyzed with stairway plot (n = 8 individuals) and white squares the rest of the populations (n < 8 individuals). Panels (b) and (c) present the inferred demographic profiles for Iberian and Canarian populations, respectively. Lines show the median estimate of effective population size (N e) over time, assuming a mutation rate of 2.8 × 10⁻⁹ and 1‐year generation time. Populations with an asterisk indicate pest outbreaks during the sampling year. Population codes are described in Table 1.
