
Figure 4.
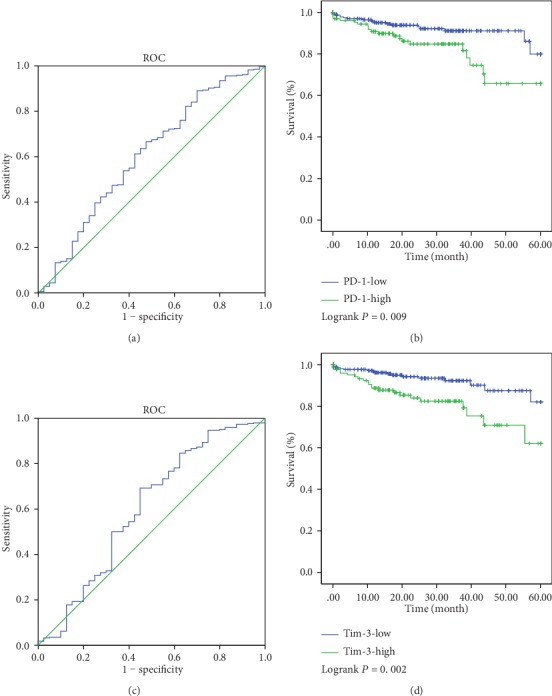
Determination of cut-off values of PD-1 and Tim-3 expressions in TCGA database and survival analyses. The optimal cut-off value for the PD-1 and Tim-3 expressions was determined by ROC analysis of 5-year OS using patients' data in TCGA database (a, c). The Kaplan-Meier plotters were used to analyze the 5-year OS (b, d). The optimal cut-off value for PD-1 was 4.33 (P = 0.009). The optimal cut-off value for Tim-3 was 4.80 (P = 0.002).