Figure 3.

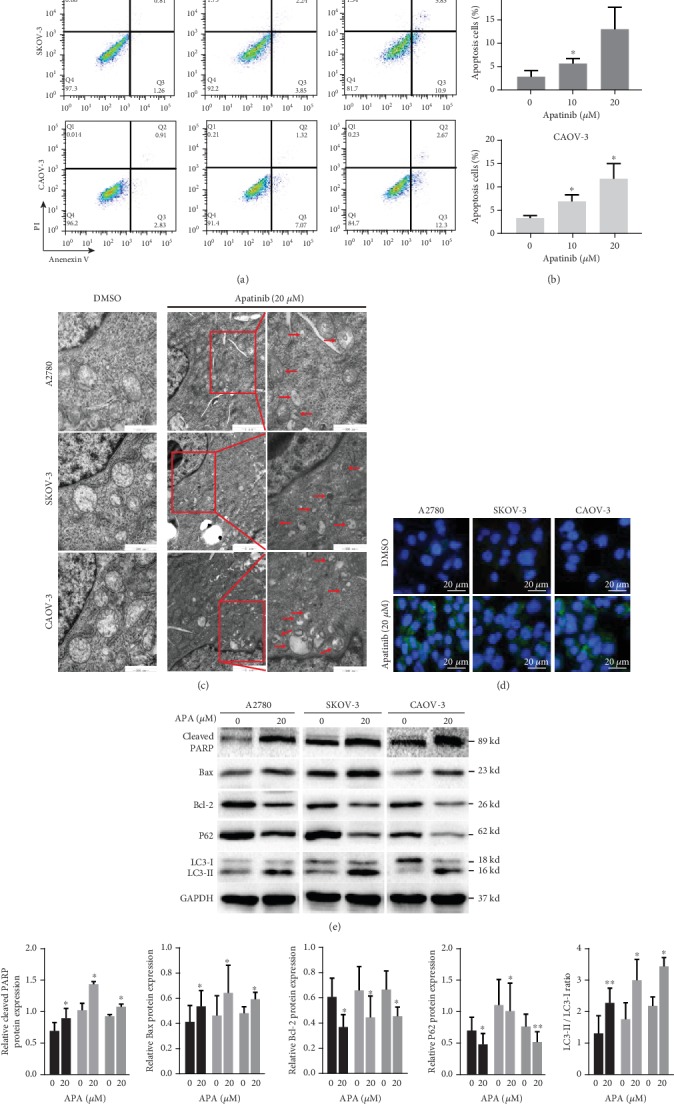
Apatinib induced apoptosis and autophagy in OC cells. (a) After treatment of A2780, SKOV-3, and CAOV-3 cells with apatinib (0, 10, and 20 μM) for 24 h, these cells were stained with Annexin V-FITC/PI and analyzed by a flow cytometer. (b) The quantitative analysis of the apoptotic cell percentages is shown. (c) The representative images of TEM: more autophagic vacuoles (red arrows) are shown in the three apatinib-treated (20 μM) OC cell lines for 24 h compared with the DMSO-treated control groups. Scale bar = 1 μm (the middle panel)/500 nm (the left and right panels). (d) The representative images of immunofluorescence: a dot pattern of LC3-II fluorescence is presented in the apatinib-treated (20 μM) OC cells (40x). Scale bar = 20 μm. (e) After treatment with 20 μM apatinib for 24 h, the protein levels of cleaved PARP, Bcl-2, Bax, p62, and LC3B (LC3 II/LC3 I) were determined by western blotting. (f) The relative western blot gray values are shown in the histogram. Data are presented as the mean ± SD of three independent experiments. APA: apatinib.∗P < 0.05, ∗∗P < 0.01, compared with the control groups.
