
Figure 1.
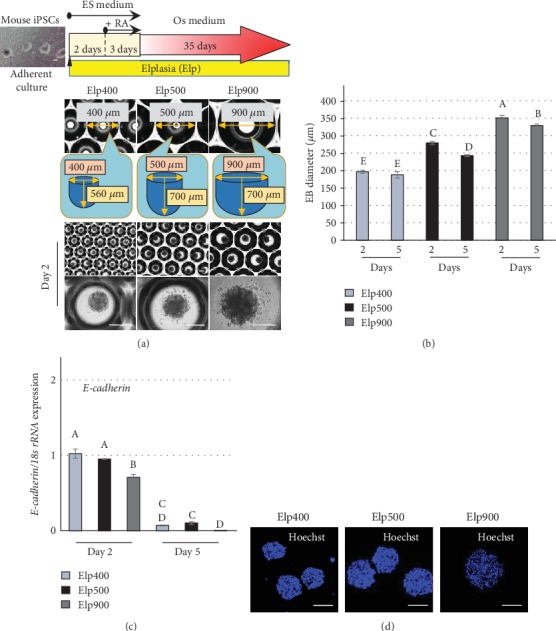
Microspace size influences the condensation of iPSC aggregates. (a) Fabrication and osteogenic induction of 3D-iPSC constructs. Representative images of iPSC aggregates were obtained under phrase-contrast microscopy after 2 days of aggregation in Elp400, Elp500, and Elp900. Scale bars: 200 μm. (b) Size measurement of iPSC aggregates using ImageJ software (National Institutes of Health, Bethesda, MD, USA) to analyze Ferret's diameter at culture days 2 and 5. Different letters indicate significant differences between each group (P < 0.05, ANOVA with Tukey's multiple comparison test). The data represent the mean ± SD (n = 3). (c) Cell-cell adhesion marker gene expression with different microspace sizes. E-cadherin expression was determined by quantitative real-time RT-PCR at days 2 and 5. Different letters indicate significant differences between groups (P < 0.05, ANOVA with Tukey's multiple comparison test). The data represent the mean ± SD (n = 3). (d) Representative images of nuclear staining of iPSC aggregates using Hoechst. Scale bars: 200 μm.