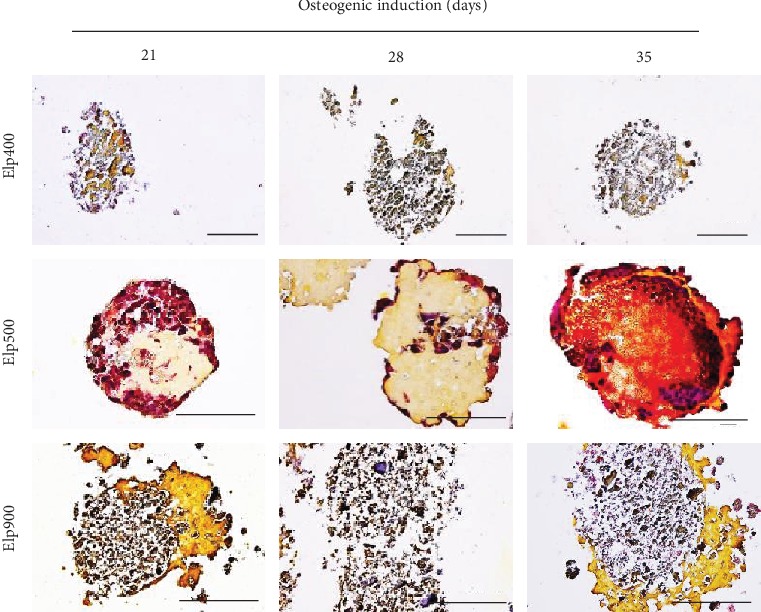
Figure 5.

Microspace size influences osteoid formation of OI-iPSC constructs. Histological analysis using Movat's pentachrome staining was performed on paraffin-embedded sections (without decalcification) of OI-iPSC constructs at days 21, 28, and 35. Representative images of OI-iPSC constructs cultured in Elp400, Elp500, and Elp900 are shown. Different colors indicate different components of OI-iPSC constructs: black color for nuclei, red color for cytoplasm/osteoid/coarse collagen fibers, and yellow color for collagen fiber/calcification. Scale bars: 100 μm.
