Figure 7.

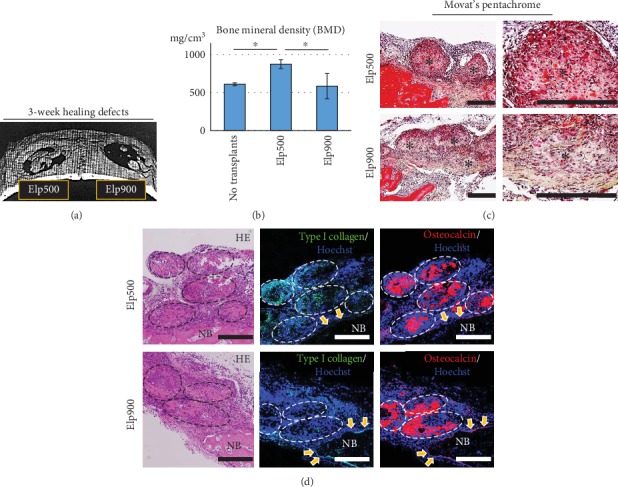
Comparative bone regeneration capacity of OI-iPSC constructs fabricated using Elp500 and Elp900 in critical-size calvarial defects. After healing for 3 weeks, new bone formation was evaluated using micro-CT and histological and immunofluorescent staining. (a) Representative 3D reconstruction image from micro-CT showing new bone formation in the defect area. (b) New bone formation was quantitatively analyzed by bone morphometry. Asterisks indicate statistically significant differences (P < 0.05, ANOVA with Tukey's multiple comparison test). The data represent the mean ± SD (n = 4). (c) Movat's pentachrome staining of decalcified sections of a defect after healing for 3 weeks. Right panels show magnifications of the OI-iPSC constructs of the left panels. Asterisks indicate the constructs. Scale bars: 200 μm. (d) Immunofluorescent analysis of type I collagen and osteocalcin in remaining OI-iPSC constructs. The dashed oval regions show the remaining OI-iPSC constructs. Yellow arrows indicate osteoblasts lining the new bone (NB) area. Scale bars: 200 μm.
