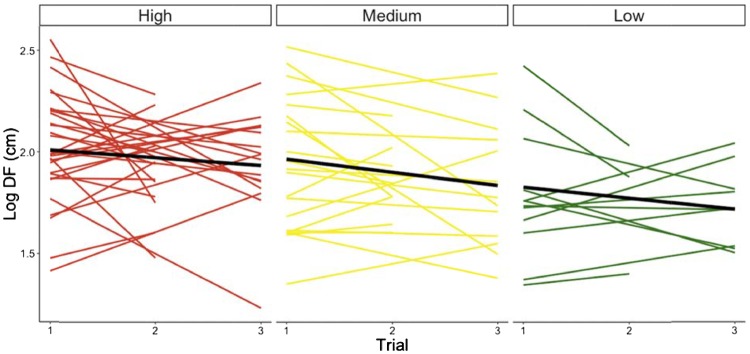
Figure 2.
Skink DF responses across multiple approaches. Shown are the means and slopes of log10 DF from individuals after multiple flushes at the 3 sites which vary in their degree of human exposure. Thick black line indicates the average slope per site. Low site average slope is significantly lower than high site average slope.

