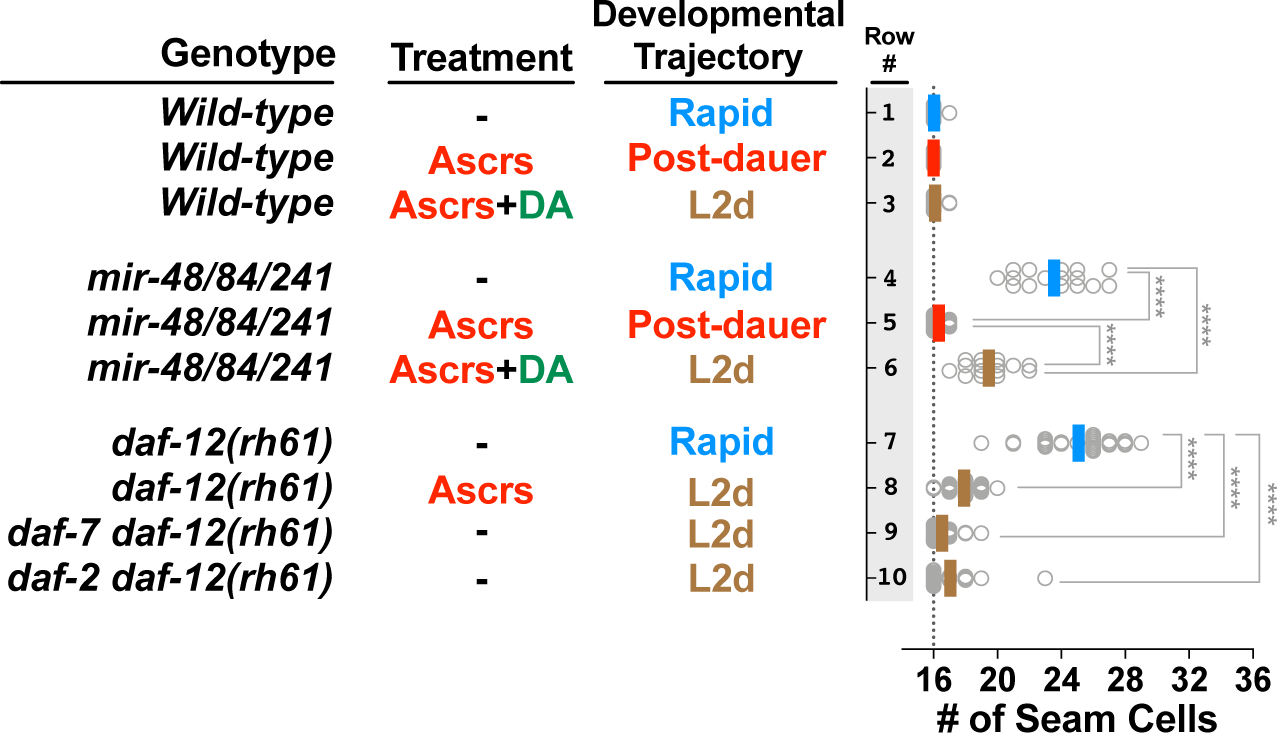
Figure 2. Sensitized genetic backgrounds reveal that L2d-inducing environmental and endocrine signals impact the regulation of temporal cell fates.

Genotypes are indicated in the first column; treatments and corresponding developmental trajectories are indicated in the second and third columns, respectively. Each dot in the plots to the right shows the number of seam cells on one side (left side or right side, observed interchangeably) of a single young adult animal, and solid lines (color code matching the developmental trajectory) indicate the average seam cell number of the animals scored for each condition. Wild-type animals have sixteen seam cells per side (vertical dotted line), regardless of developmental trajectory (lines 1–3). Experiments involving temperature sensitive alleles of daf-2 and daf-7 (lines 6 and 7) are performed at a permissive temperature (20°C) that allows continuous (L2d-to-L3 without dauer arrest) development. The student’s t-test is used to calculate statistical significance (p): n.s.(not significant) p>0.05, *p<0.05, **p<0.01, ***p<0.001, ****p<0.0001. See also Figure S1 and S2 and Table S1.
