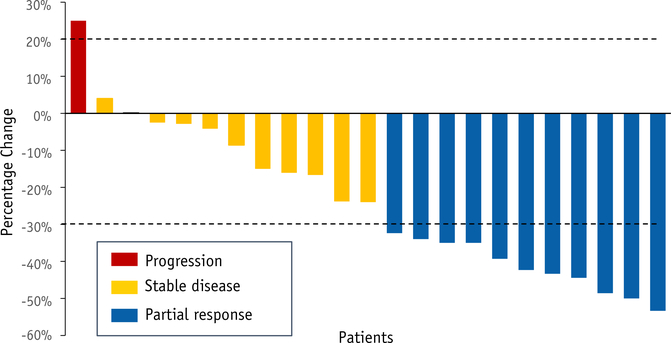
Fig. 2.
Tumor response based on response evaluation criteria in solid tumors criteria. Best overall response rate is 44% and disease control rate is 88%. Two patients with no follow-up scans were considered nonevaluable. Dotted line above x-axis represents 20% increase in sum of target lesions from nadir, and below x-axis represents 30% decrease in sum of target lesions from baseline.

