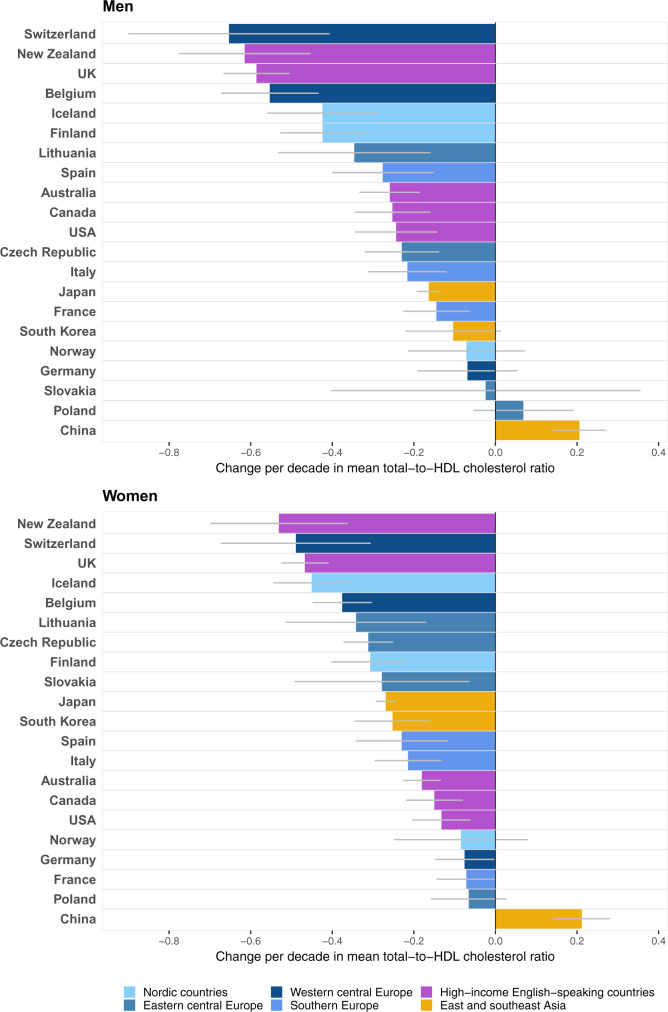
Figure 4.
Change per decade in mean total-to-HDL cholesterol ratio by sex in people aged 40–59 years. Results for each country apply to its period of HDL and non-HDL cholesterol data availability (Supplementary Table 2, available as Supplementary data at IJE online). See Supplementary Table 4, available as Supplementary data at IJE online, for numerical results and 95% confidence intervals.

