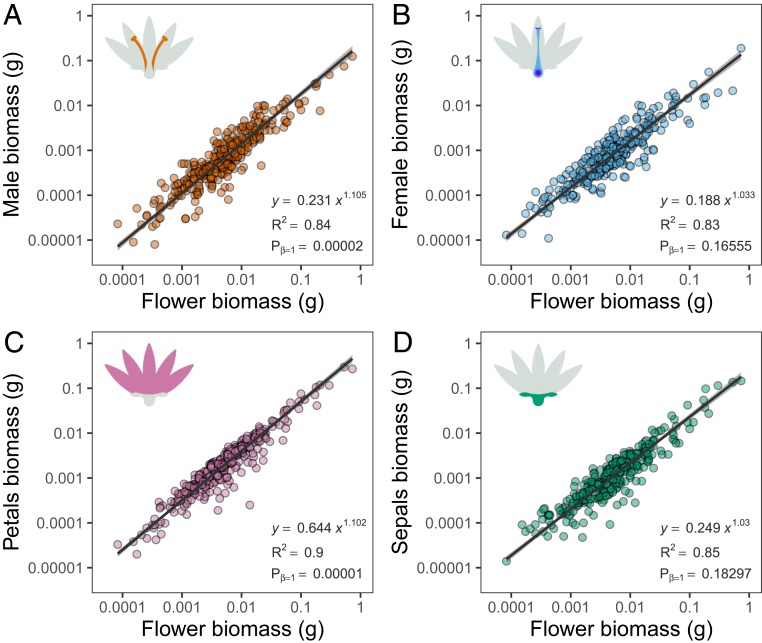
Fig. 2.
Across-species flower allometries of 307 angiosperm species. Standardized major-axis relationship between flower biomass and the biomass allocated to (A) male organs, (B) female organs, (C) group of petals (corolla), and (D) group of sepals (calyx). All axes are log10-transformed. The black lines are standardized major-axis line fits and the gray shadow their 95% CI. Allometric equations (Y = αXβ) and R2 are provided. Pβ=1 indicates the probability of rejecting the isometric hypothesis (β = 1). See SI Appendix for sensitivity analysis details.

