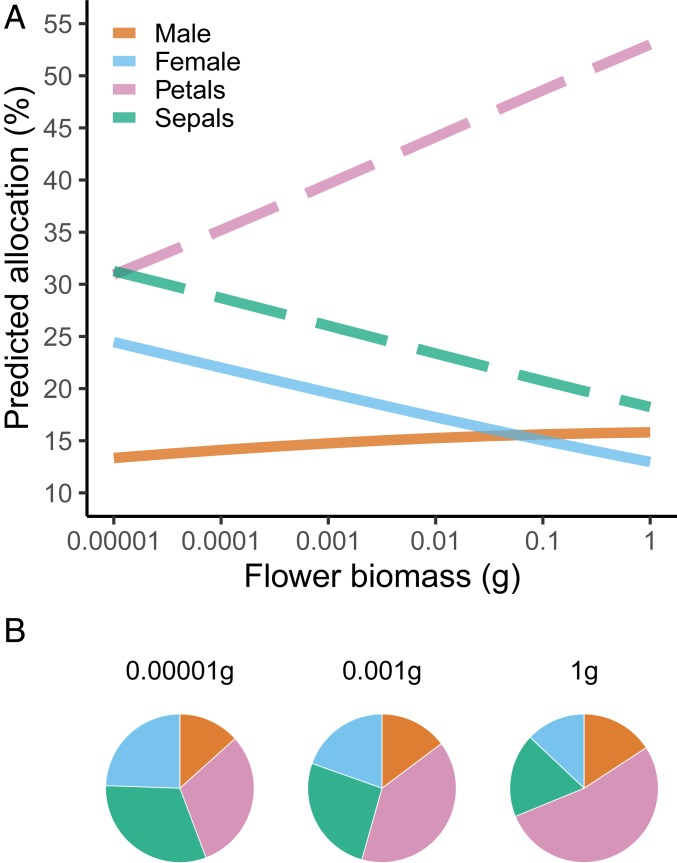
Fig. 3.
Relative biomass allocation in primary (male and female) and secondary (petals and sepals) sexual organs along the flower biomass gradient. (A) Predicted allocation (%) calculated from mean unbiased estimates for each component at a given total flower mass according to the OLS allometric regression models (Methods and SI Appendix), and then converted into percentages. (B) Visual representation of biomass partitioning between lighter (0.00001 g), medium (0.001 g), and heavier (1.0 g) flowers.

