Fig. 6.
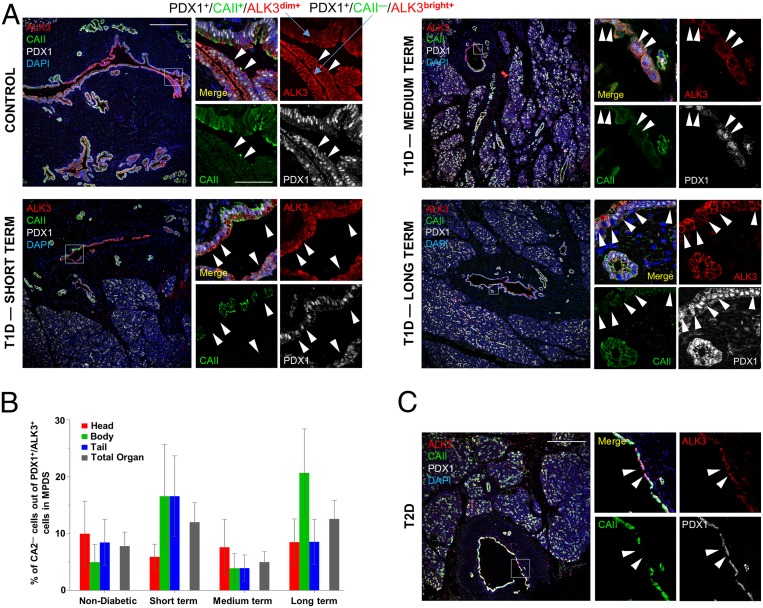
PDX1+/ALK3+/CAII− cells are present in the large ducts of T1D/T2D donors. (A) Representative confocal immunofluorescence imaging of a z-stack maximal projection showing expression of ALK3 (red), CAII (green), PDX1 (gray), and DAPI (blue) from human donors. (Left) Nondiabetic (Upper) and short-term T1D (Lower). (Right) Medium-term (Upper) and long-term (Lower) T1D. White arrowheads indicate cells with a PDX1+/ALK3+/CAII− phenotype. (B) Quantification of PDX1+/ALK3+/CAII− cells calculated as a percentage of overall PDX1+/ALK3+ ductal cells in large human pancreatic ducts across the head, body, and tail of the pancreas, for control, short-term, medium-term, and long-term diabetic donors. Error bars: SE. No statistically significant differences were detected between groups. (C) Representative confocal immunofluorescence imaging of a z-stack maximal projection showing the presence of PDX1+/ALK3+/CAII− cells in a T2D donor. (Scale bars, 200 µm for low-magnification and 50 µm for high-magnification images.)

