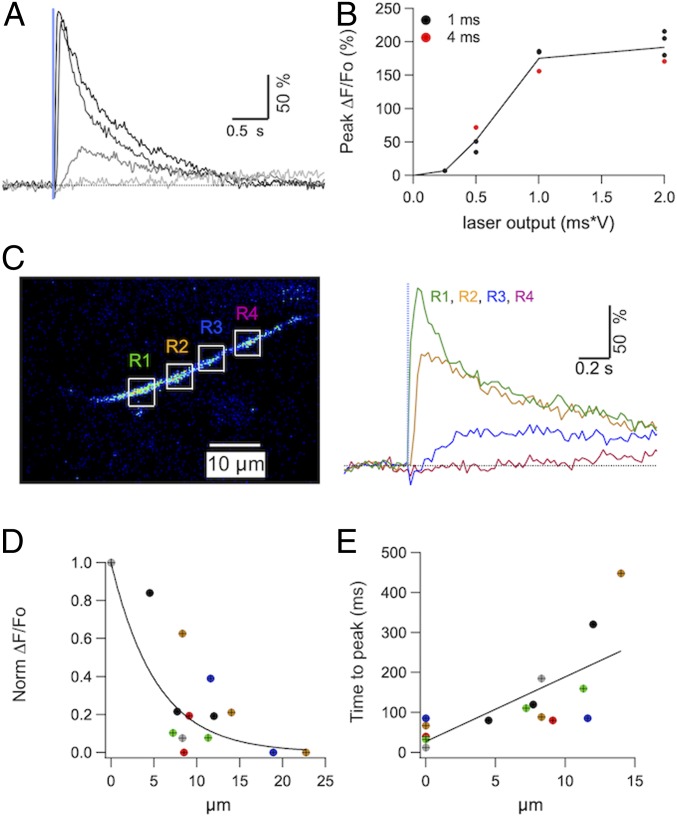
Fig. 3.
Dependence of IP3-evoked Cai rises on space and photolysis parameters. (A) Cai rises evoked in an axonal varicosity by 1-ms laser pulses of amplitudes 0.25, 0.5, 1, and 2 V, showing that peak amplitude and onset speed increase as a function of laser intensity. (B) The relation between peak Cai rise and laser output (the product of laser intensity with pulse duration) for the experiment shown in B is displayed for laser pulse durations of 1 ms (black) and 4 ms (red). The results are fit with a single relation (line) showing supralinearity at low output values and saturation at high output values. (C, Left) Multiple ROI two-photon scan was performed as detailed in Methods to probe for the diffusional properties of the IP3-evoked Cai rise. In this example, four axonal regions (R1 to R4) outlined by white boxes were scanned and the 405-nm laser was centered close to the right edge of R1. (C, Right) Both signal amplitude and onset speed decrease with distance from the targeted axonal site. (D) Data from six experiments (each represented by a different color) showing the dependence of peak Cai rise on distance from the photolysis site. Peak ΔF/Fo values were normalized to the value at the targeted site (x = 0 μm). The black line corresponds to the fit of the data by a single exponential function with a space constant of 5.3 μm. (E) Relation between time to peak and distance for the same data set as in D. The black line corresponds to the fit by a linear function. The slope of this line, 16.1 ms/μm, is different from 0 (Pearson’s coefficient 0.735, n = 16; P < 0.01), indicating a significant positive correlation between distance and rise time.

