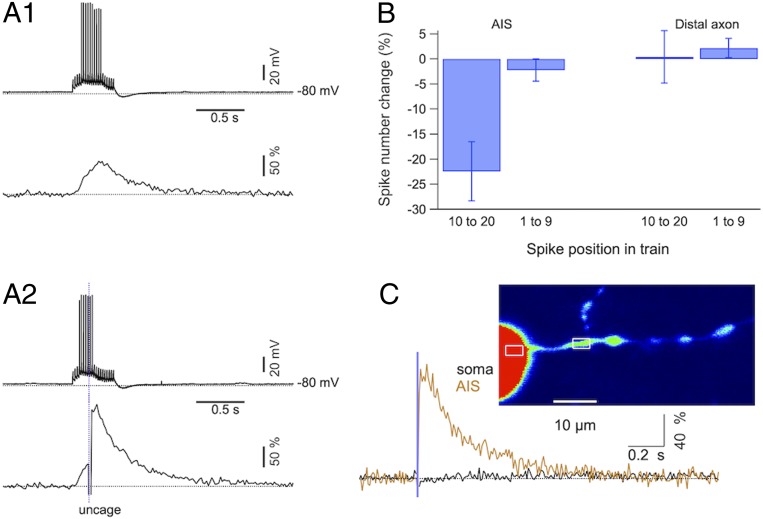
Fig. 6.
IP3 photolysis in the axon initial segment inhibits firing. (A1) Upper trace: Membrane voltage recorded under current clamp during a 50-Hz train of 20 pulses of 5-ms duration and 750-pA amplitude, leading to spikes in 10 out of the 20 pulses. Lower trace: Corresponding ΔF/Fo trace recorded in the AIS. (A2) A subsequent run in the same experiment where a photolysis pulse (1-ms duration, 2-V amplitude) was delivered to the AIS after the ninth pulse. Note the decrease in the number of spikes for the time period following the laser pulse and the larger amplitude of the Cai rise, which has an inflection on its rising phase corresponding to the onset of the photolysis-evoked response. (B) Pooled data showing percentage changes in the number of APs when applying a laser pulse (as in A2) compared to the number without the laser pulse (as in A1). For each experiment, AP numbers were analyzed in two time periods, before and after the time of the laser pulse (respectively, for spike positions 1 through 9 and for spike positions 10 through 20). Data from 15 experiments were divided in two groups depending on the location of the axonal site targeted for photolysis. The AIS group included experiments with the site located at less than 26 μm from the soma exit, whereas the distal axon group included experiments for which this distance was larger than 30 μm. Bars denote SEM. The only group that differs significantly from 0 is that of the last 11 pulses for the AIS, with Student’s t and P values of −3.8 and 0.004. Corresponding values for the first 9 pulses at the AIS were −0.98 and 0.4. Values for the distal axon are 0.08 and 0.9 (last 11 pulses), and 1.1 and 0.4 (first 9 pulses). (C) Parallel scans over the AIS and over an equal-size somatic region, as shown in the Top image. A photolysis pulse (1-ms duration, 2-V amplitude) induces a Cai rise in the AIS (yellow) but not in the soma (black).

