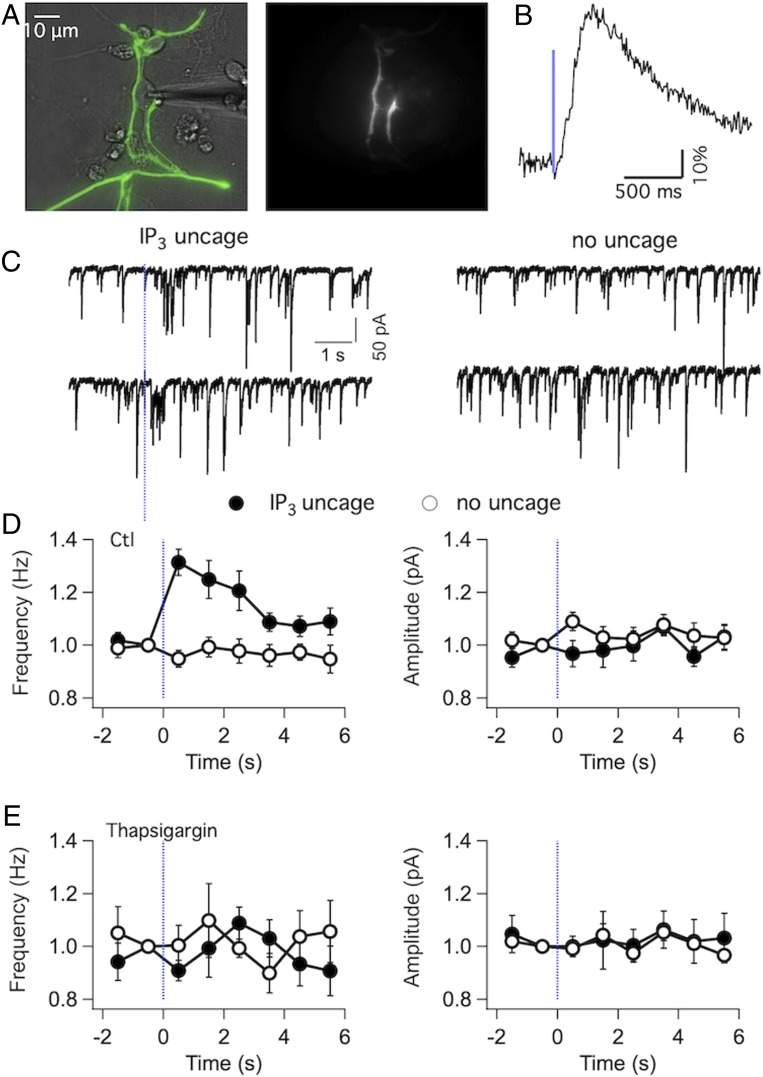
Fig. 7.
IP3 photolysis elicits GABA release from axons of cultured PCs. (A) Transmitted image of a DCN neuron under WCR (Left) and the EGFP fluorescence image upon 405-nm laser illumination (Right) of the same field showing the IP3-photolysed PC terminals surrounding the patched soma. The culture was loaded with a permeable version of caged IP3, as detailed in Methods. (B) Time course of the Cai rise recorded from putative boutons over DCN somata using the Ca2+-sensitive protein RFP670. The photolysis pulse has 1-ms duration and 5-V amplitude. (C, Left) Two representative traces of mIPSCs, recorded at a holding potential of −70 mV. The dashed bar indicates the time of photolysis, with a pulse duration of 1 ms and amplitude of 5 V. Note increase in mIPSC frequency shortly after uncaging. (C, Right) Similar recording from the same neuron, with no photolysis performed. (D) mIPSC frequency (Left) and amplitude (Right) values from 10 experiments are binned over 1-s time bins and displayed as a function of time (open circles: no photolysis; closed circles: photolysis). (E) Corresponding analysis from six experiments where 1 μM thapsigargin was applied for 20 min prior to recording. Paired Student’s t test was done to compare frequency and amplitude values for control versus photolysis runs in the first time bin after photolysis in D and E. Frequency for the experiments summarized in D, Left showed a significant difference, with t and P values of 4.0 and 0.003, indicating IP3-induced GABA release. By contrast, no statistical difference was present for the amplitude values in test experiments (D, Right), nor for frequency or amplitude values in thapsigargin experiments (E).

